Copyright
©The Author(s) 2004.
World J Gastroenterol. Jul 15, 2004; 10(14): 2050-2054
Published online Jul 15, 2004. doi: 10.3748/wjg.v10.i14.2050
Published online Jul 15, 2004. doi: 10.3748/wjg.v10.i14.2050
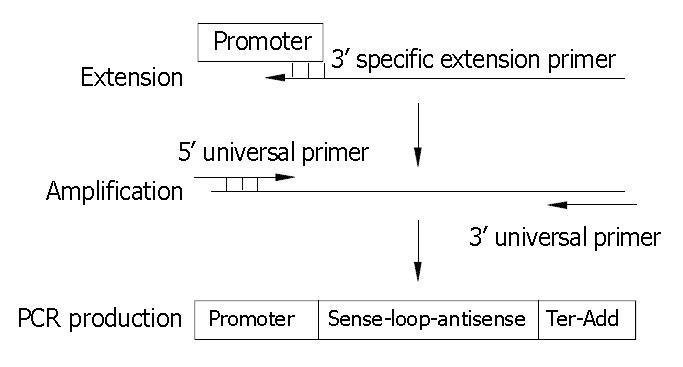
Figure 1 Schematic representation of one-step overlapping extension PCR strategy used to yield SECs.
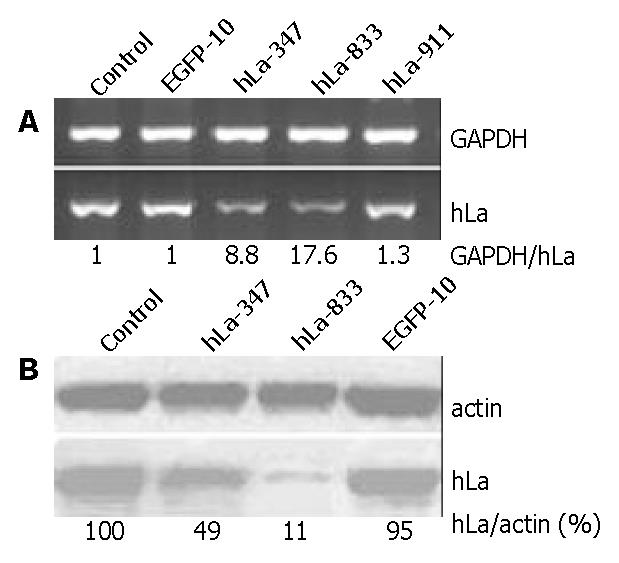
Figure 2 Effect of RNAi on hLa expression in HepG2 cells.
A: Total RNA isolated from HepG2 cells transfected with various SECs for hLa and EGFP. The number was the ratio between the signal intensity for GAPDH and hLa mRNA amplified in parallel. B: Western blotting of total cell lysates harvested from SECs-transfected HepG2 cells 72 h posttransfection. Actin was used as loading control. The number was the percentage of the signal intensity of hLa and actin protein (%).
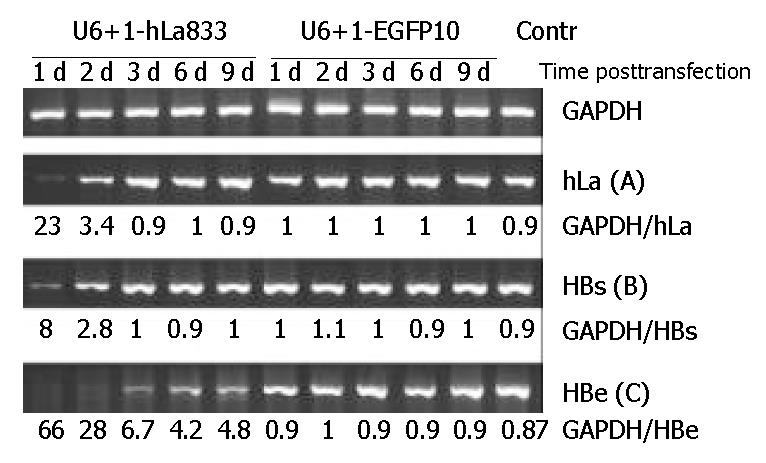
Figure 3 Effect of RNAi on hLa mRNA expression and levels of HBV mRNA expression in 2.
2.15 cells. The number was the ratio between the signal intensity for hLa, HBs, HBe, and GAPDH mRNA amplified in parallel.
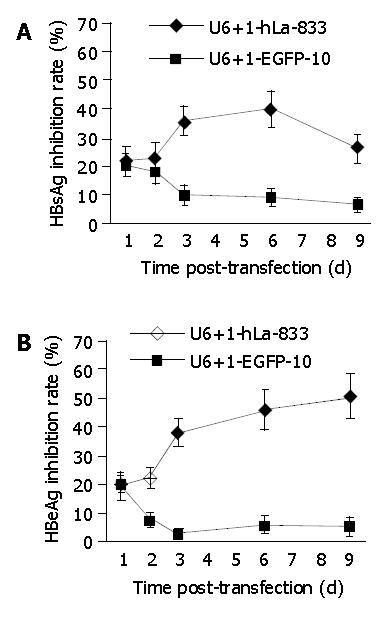
Figure 4 Time-efficiency inhibition course of SECs on HBsAg and HBeAg in 2.
2.15 cells. The inhibition rate (IR) was calculated according to the following formula:
IR = [(χ of wells for control-χ of wells for thansfection)/(χ of wells for control - N)] × 100%
χ represents S/N or S/CO for HBsAg or HBeAg, and n = 2.0 for HBsAg and 2.1 for HBeAg respectively.
- Citation: Ni Q, Chen Z, Yao HP, Yang ZG, Liu KZ, Wu LL. Inhibition of human La protein by RNA interference downregulates hepatitis B virus mRNA in 2.2.15 cells. World J Gastroenterol 2004; 10(14): 2050-2054
- URL: https://www.wjgnet.com/1007-9327/full/v10/i14/2050.htm
- DOI: https://dx.doi.org/10.3748/wjg.v10.i14.2050


