Copyright
©The Author(s) 2004.
World J Gastroenterol. Jun 1, 2004; 10(11): 1600-1607
Published online Jun 1, 2004. doi: 10.3748/wjg.v10.i11.1600
Published online Jun 1, 2004. doi: 10.3748/wjg.v10.i11.1600
Figure 1 cDNA microarray scanning result of gene expression profile between quiescent HSC and activated HSC.
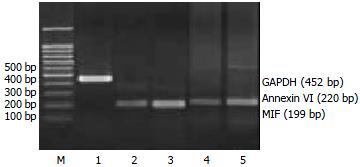
Figure 2 Electrophoresis analysis of RT-PCR products.
Lane M: 100 bp DNA ladder; Lane 1: GAPDH; Lane 2, 3: MIF amplified from quiescent HSC and activated HSC mRNA respectively; Lane 3 shows increased expression of MIF in activated HSC compared with lane 2 in quiescent HSC. Lane 4, 5: Annexin VI amplified from quiescent HSC and activated HSC mRNA respectively; Lane 5 shows increased expression of Annexin VI in activated HSC compared with lane 4 in quiescent HSC.
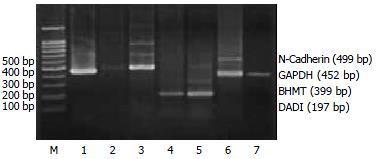
Figure 3 Electrophoresis analysis of RT-PCR products.
Lane M: 100 bp DNA ladder; Lane 1: GAPDH; Lane 2, 3: N-Cadherin amplified from quiescent HSC and activated HSC mRNA respectively; Lane 3 shows increased expression of N-Cadherin in activated HSC compared with lane 2 in quiescent HSC. Lane 4, 5: DAD1 amplified from quiescent HSC and activated HSC mRNA respectively; Lane 5 shows increased expression of Annexin VI in activated HSC compared with lane 4 in quiescent HSC. Lane 6, 7: BHMT amplified from quiescent HSC and activated HSC mRNA respectively; Lane 7 shows decreased expression of BHMT in activated HSC compared with lane 6 in quiescent HSC.
- Citation: Liu XJ, Yang L, Luo FM, Wu HB, Qu-Qiang. Association of differentially expressed genes with activation of mouse hepatic stellate cells by high-density cDNA mircoarray. World J Gastroenterol 2004; 10(11): 1600-1607
- URL: https://www.wjgnet.com/1007-9327/full/v10/i11/1600.htm
- DOI: https://dx.doi.org/10.3748/wjg.v10.i11.1600


