Copyright
©The Author(s) 2004.
World J Gastroenterol. May 15, 2004; 10(10): 1466-1470
Published online May 15, 2004. doi: 10.3748/wjg.v10.i10.1466
Published online May 15, 2004. doi: 10.3748/wjg.v10.i10.1466
Figure 1 Western blot analysis of annexin I in pancreatic duc-tal adenocarcinoma.
Ten micrograms of total protein extracts from pancreatic tissues and cell lines were run on 120 g/L SDS-PAGE, and annexin I protein expression was probed with mouse anti-annexin I monoclonal antibody and visualized by chemiluminescence (top panel). C: pancreatic ductal adenocar-cinoma tissues; N: normal pancreas tissues; BxPC-3: human pancreatic adenocarcinoma cell line. α-Tubulin was used as an internal control (bottom panel).
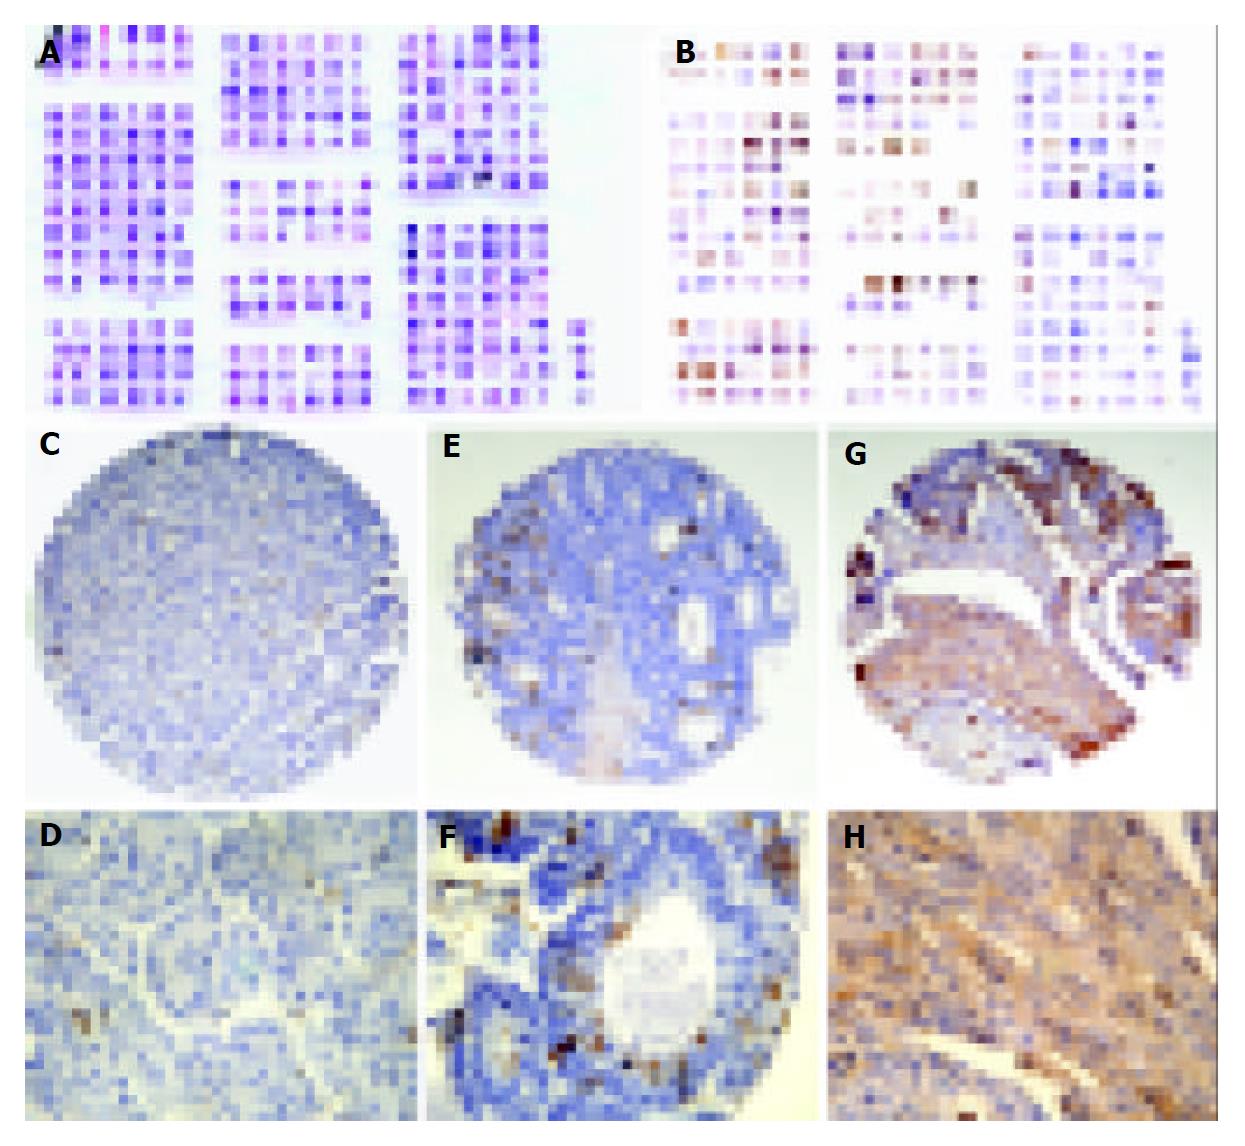
Figure 2 Immunohistochemical analysis of annexin I expression on pancreatic cancer MTAs.
A and B: Overview of the H & E staining and immunohistochemical staining of annexin I on pancreatic cancer MTAs; C (× 200) and D (× 400): normal pancreas; E (× 200) and F (× 400): well differentiated ductal adenocarcinoma; G (× 200) and H (× 400): poorly differentiated ductal adenocarcinoma.
- Citation: Bai XF, Ni XG, Zhao P, Liu SM, Wang HX, Guo B, Zhou LP, Liu F, Zhang JS, Wang K, Xie YQ, Shao YF, Zhao XH. Overexpression of annexin 1 in pancreatic cancer and its clinical significance. World J Gastroenterol 2004; 10(10): 1466-1470
- URL: https://www.wjgnet.com/1007-9327/full/v10/i10/1466.htm
- DOI: https://dx.doi.org/10.3748/wjg.v10.i10.1466


