Copyright
©The Author(s) 2004.
World J Gastroenterol. May 15, 2004; 10(10): 1425-1430
Published online May 15, 2004. doi: 10.3748/wjg.v10.i10.1425
Published online May 15, 2004. doi: 10.3748/wjg.v10.i10.1425
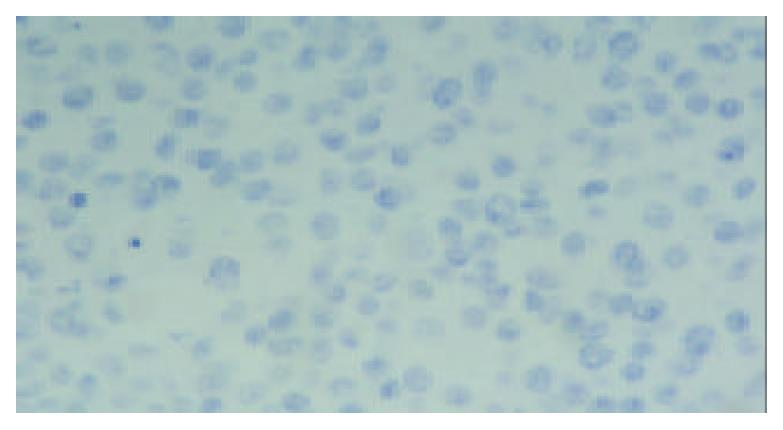
Figure 1 Negative control of p27 (× 400).
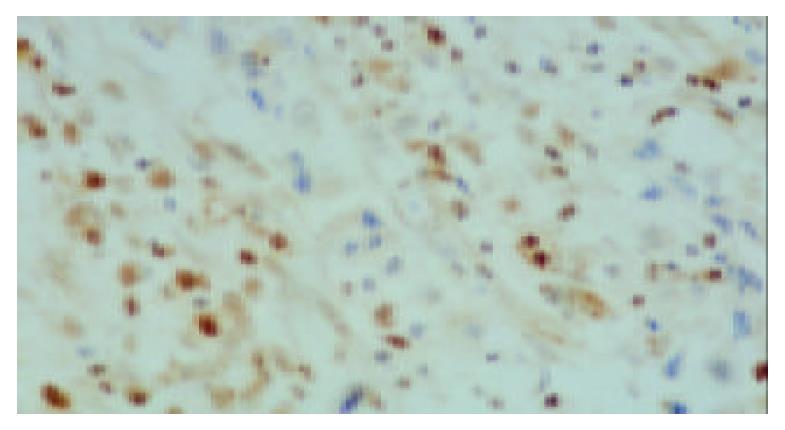
Figure 2 Positive control of p27 (× 400).
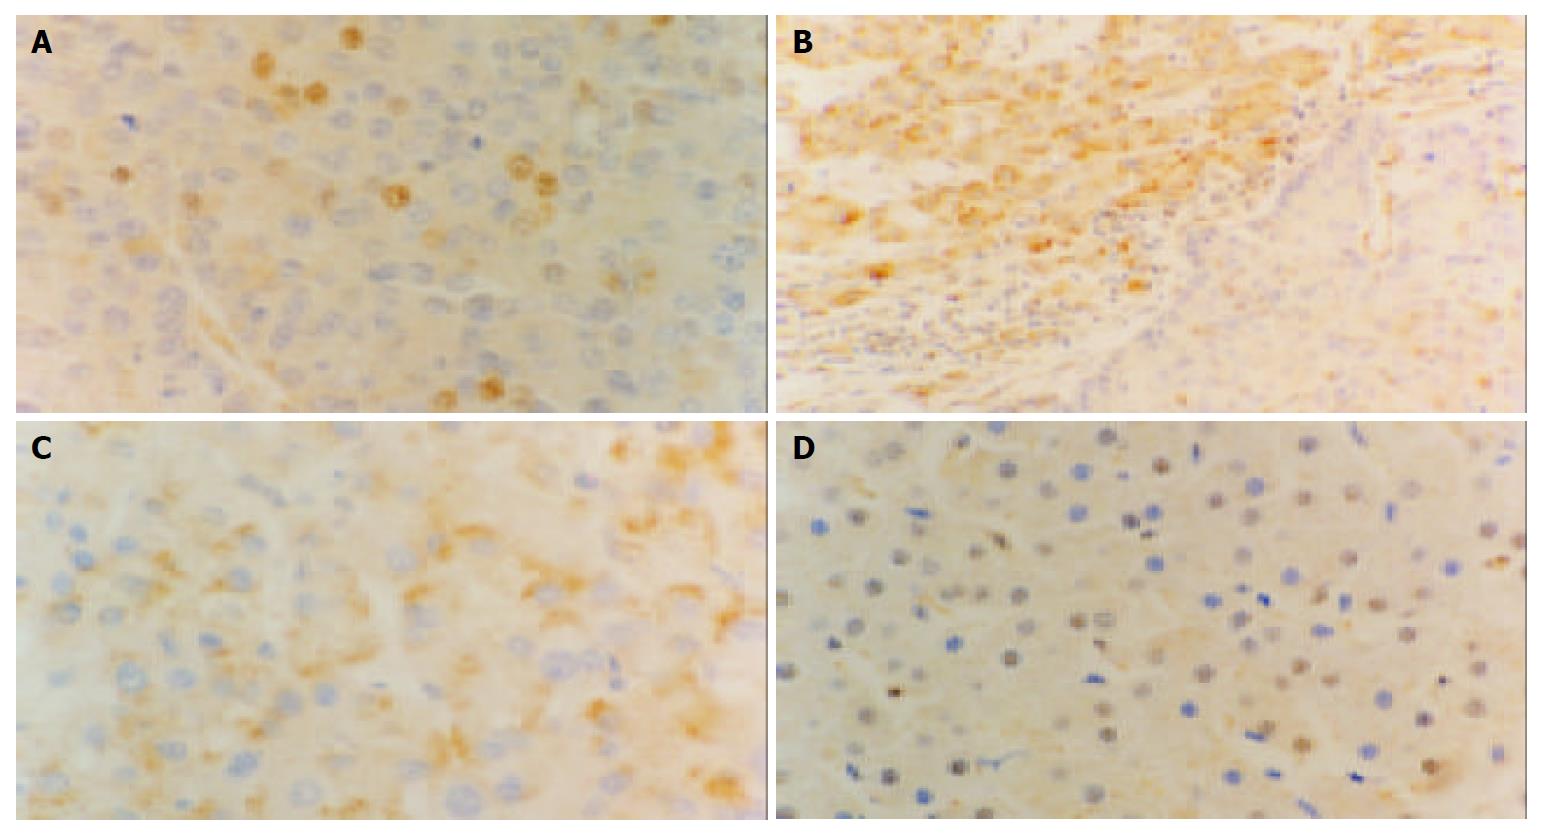
Figure 3 Immunohistochemical staining of p27 in different liver tissues (Elivision), A: p27 expression is decreased in HCC × 400, B: Decreased p27 expression in HCC (right), the p27 expression is mostly located in the cytoplasm in nontumoral liver tissues (left) × 200, C: Some tumor cells show cytoplasmic staining of p27 × 400, D: p27 staining in normal controls is mostly located in nuclear × 400.
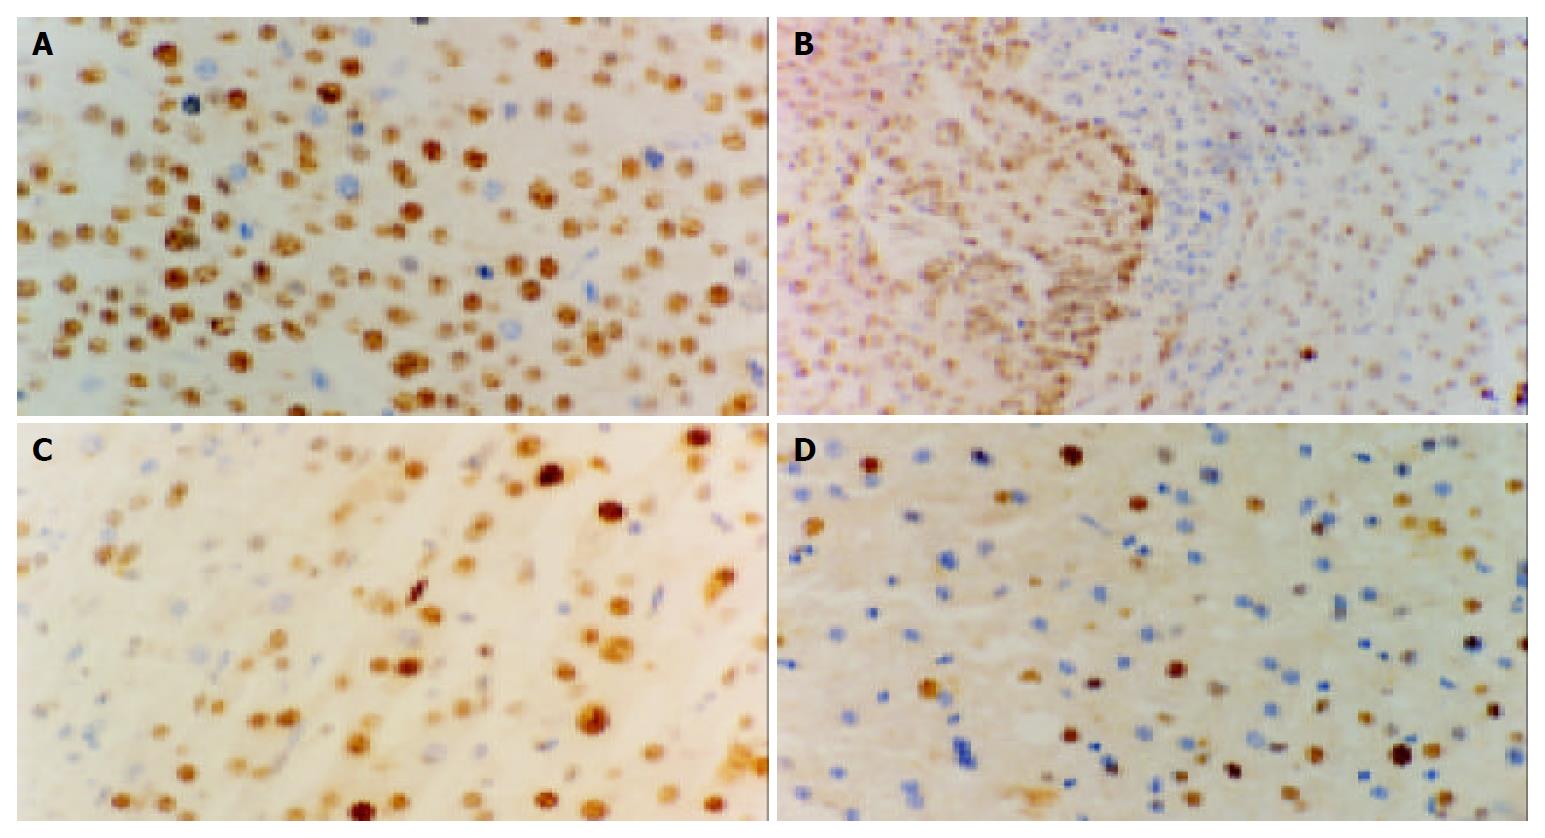
Figure 4 Expression of PCNA in different liver tissues (Elivision), A: Expression of PCNA in HCC × 400, B: Expression of PCNA in HCC (left) and in nontumoral liver tissues (right) × 200, C: Expression of PCNA in nontumoral liver tissues × 400, D: in normal controls × 400.
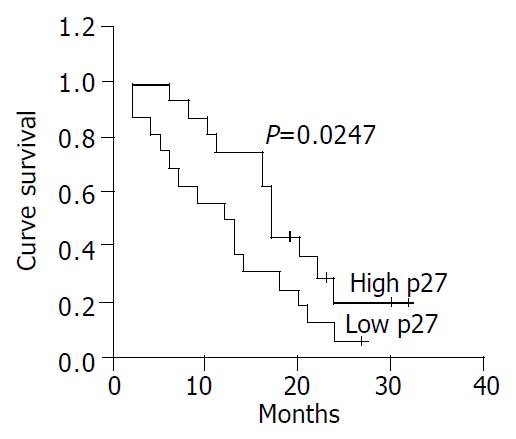
Figure 5 Kaplan-Meier curve for actuarial survival of patients in low p27 and high p27 groups.
- Citation: Nan KJ, Jing Z, Gong L. Expression and altered subcellular localization of the cyclin-dependent kinase inhibitor p27Kip1 in hepatocellular carcinoma. World J Gastroenterol 2004; 10(10): 1425-1430
- URL: https://www.wjgnet.com/1007-9327/full/v10/i10/1425.htm
- DOI: https://dx.doi.org/10.3748/wjg.v10.i10.1425


