Copyright
©The Author(s) 2004.
World J Gastroenterol. Jan 1, 2004; 10(1): 136-142
Published online Jan 1, 2004. doi: 10.3748/wjg.v10.i1.136
Published online Jan 1, 2004. doi: 10.3748/wjg.v10.i1.136
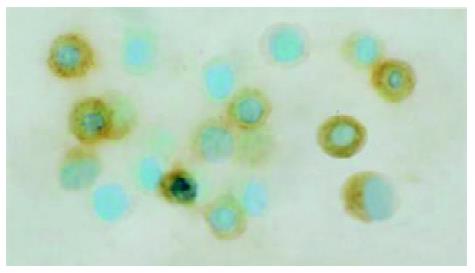
Figure 1 Immunocytochemical staining of PBMCs with monoclonal antibodies to CD3, CD4, CD8 and CD57.
Positive cells were stained green in the nuclei and yellow-brown in cytoplasm and cell membrane. The microphoto showed CD3 positive cells.
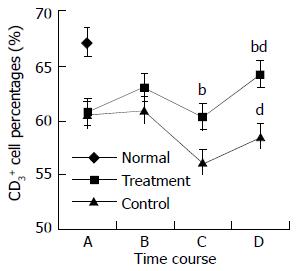
Figure 2 Changes in CD3+ cell percentages in perioperative period.
A: at randomization; B: before operation; C: on the 2nd postoperative day; and D: on the 10th postoperative day. The difference in CD3+ percentages between treatment and control groups at time points C and D was statistically significant, bP < 0.01. The difference in CD3+ percentages on the 10th postoperative day and the randomization day was statistically significant for both treatment and control groups, dP < 0.01.
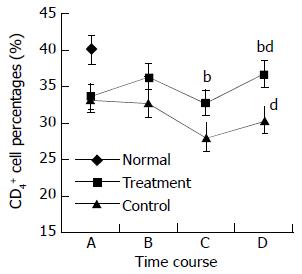
Figure 3 Changes in CD4+ cell percentages in perioperative period.
A: at randomization; B: before operation; C: on the 2nd postoperative day; and D: on the 10th postoperative day. The difference in CD4+ percentages between treatment and control groups at time points C and D was statistically significant, bP < 0.01. The differences in CD4+ percentages on the 10th postoperative day and the randomization day was statistically significant for both treatment and control groups, dP < 0.01.
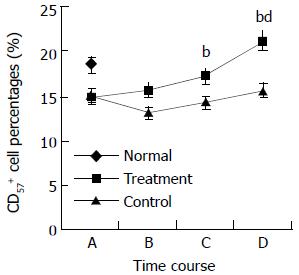
Figure 4 Changes in CD57+ cell percentages in perioperative period.
A: at randomization; B: before operation; C: on the 2nd postoperative day; and D: on the 10th postoperative day. The difference in CD57+ percentages between treatment and con-trol groups at time points C and D was statistically significant, bP < 0.01. The differences in CD57+ percentages between treat-ment group and normal control on the 10th postoperative day was statistically significant, dP < 0.01.
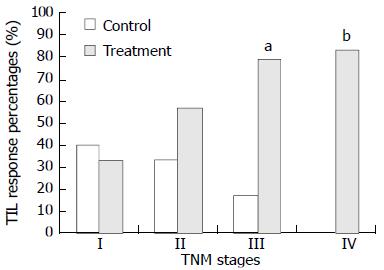
Figure 5 TIL responses in surgical specimens in treatment and control groups.
In control group, there was a progressive de-crease in TIL responses with increase of TNM staging. On the other hand, the treatment group showed a steady increase in TIL responses after CIM treatment for 1 wk. The differences in TIL response rates were statistically significant between treat-ment and control groups for TNM stages III and IV diseases (aP < 0.05 and bP < 0.01, respectively, Fisher’s exact test).
- Citation: Lin CY, Bai DJ, Yuan HY, Wang K, Yang GL, Hu MB, Wu ZQ, Li Y. Perioperative cimetidine administration promotes peripheral blood lymphocytes and tumor infiltrating lymphocytes in patients with gastrointestinal cancer: Results of a randomized controlled clinical trial. World J Gastroenterol 2004; 10(1): 136-142
- URL: https://www.wjgnet.com/1007-9327/full/v10/i1/136.htm
- DOI: https://dx.doi.org/10.3748/wjg.v10.i1.136


