Copyright
©The Author(s) 2021.
World J Meta-Anal. Aug 28, 2021; 9(4): 353-376
Published online Aug 28, 2021. doi: 10.13105/wjma.v9.i4.353
Published online Aug 28, 2021. doi: 10.13105/wjma.v9.i4.353
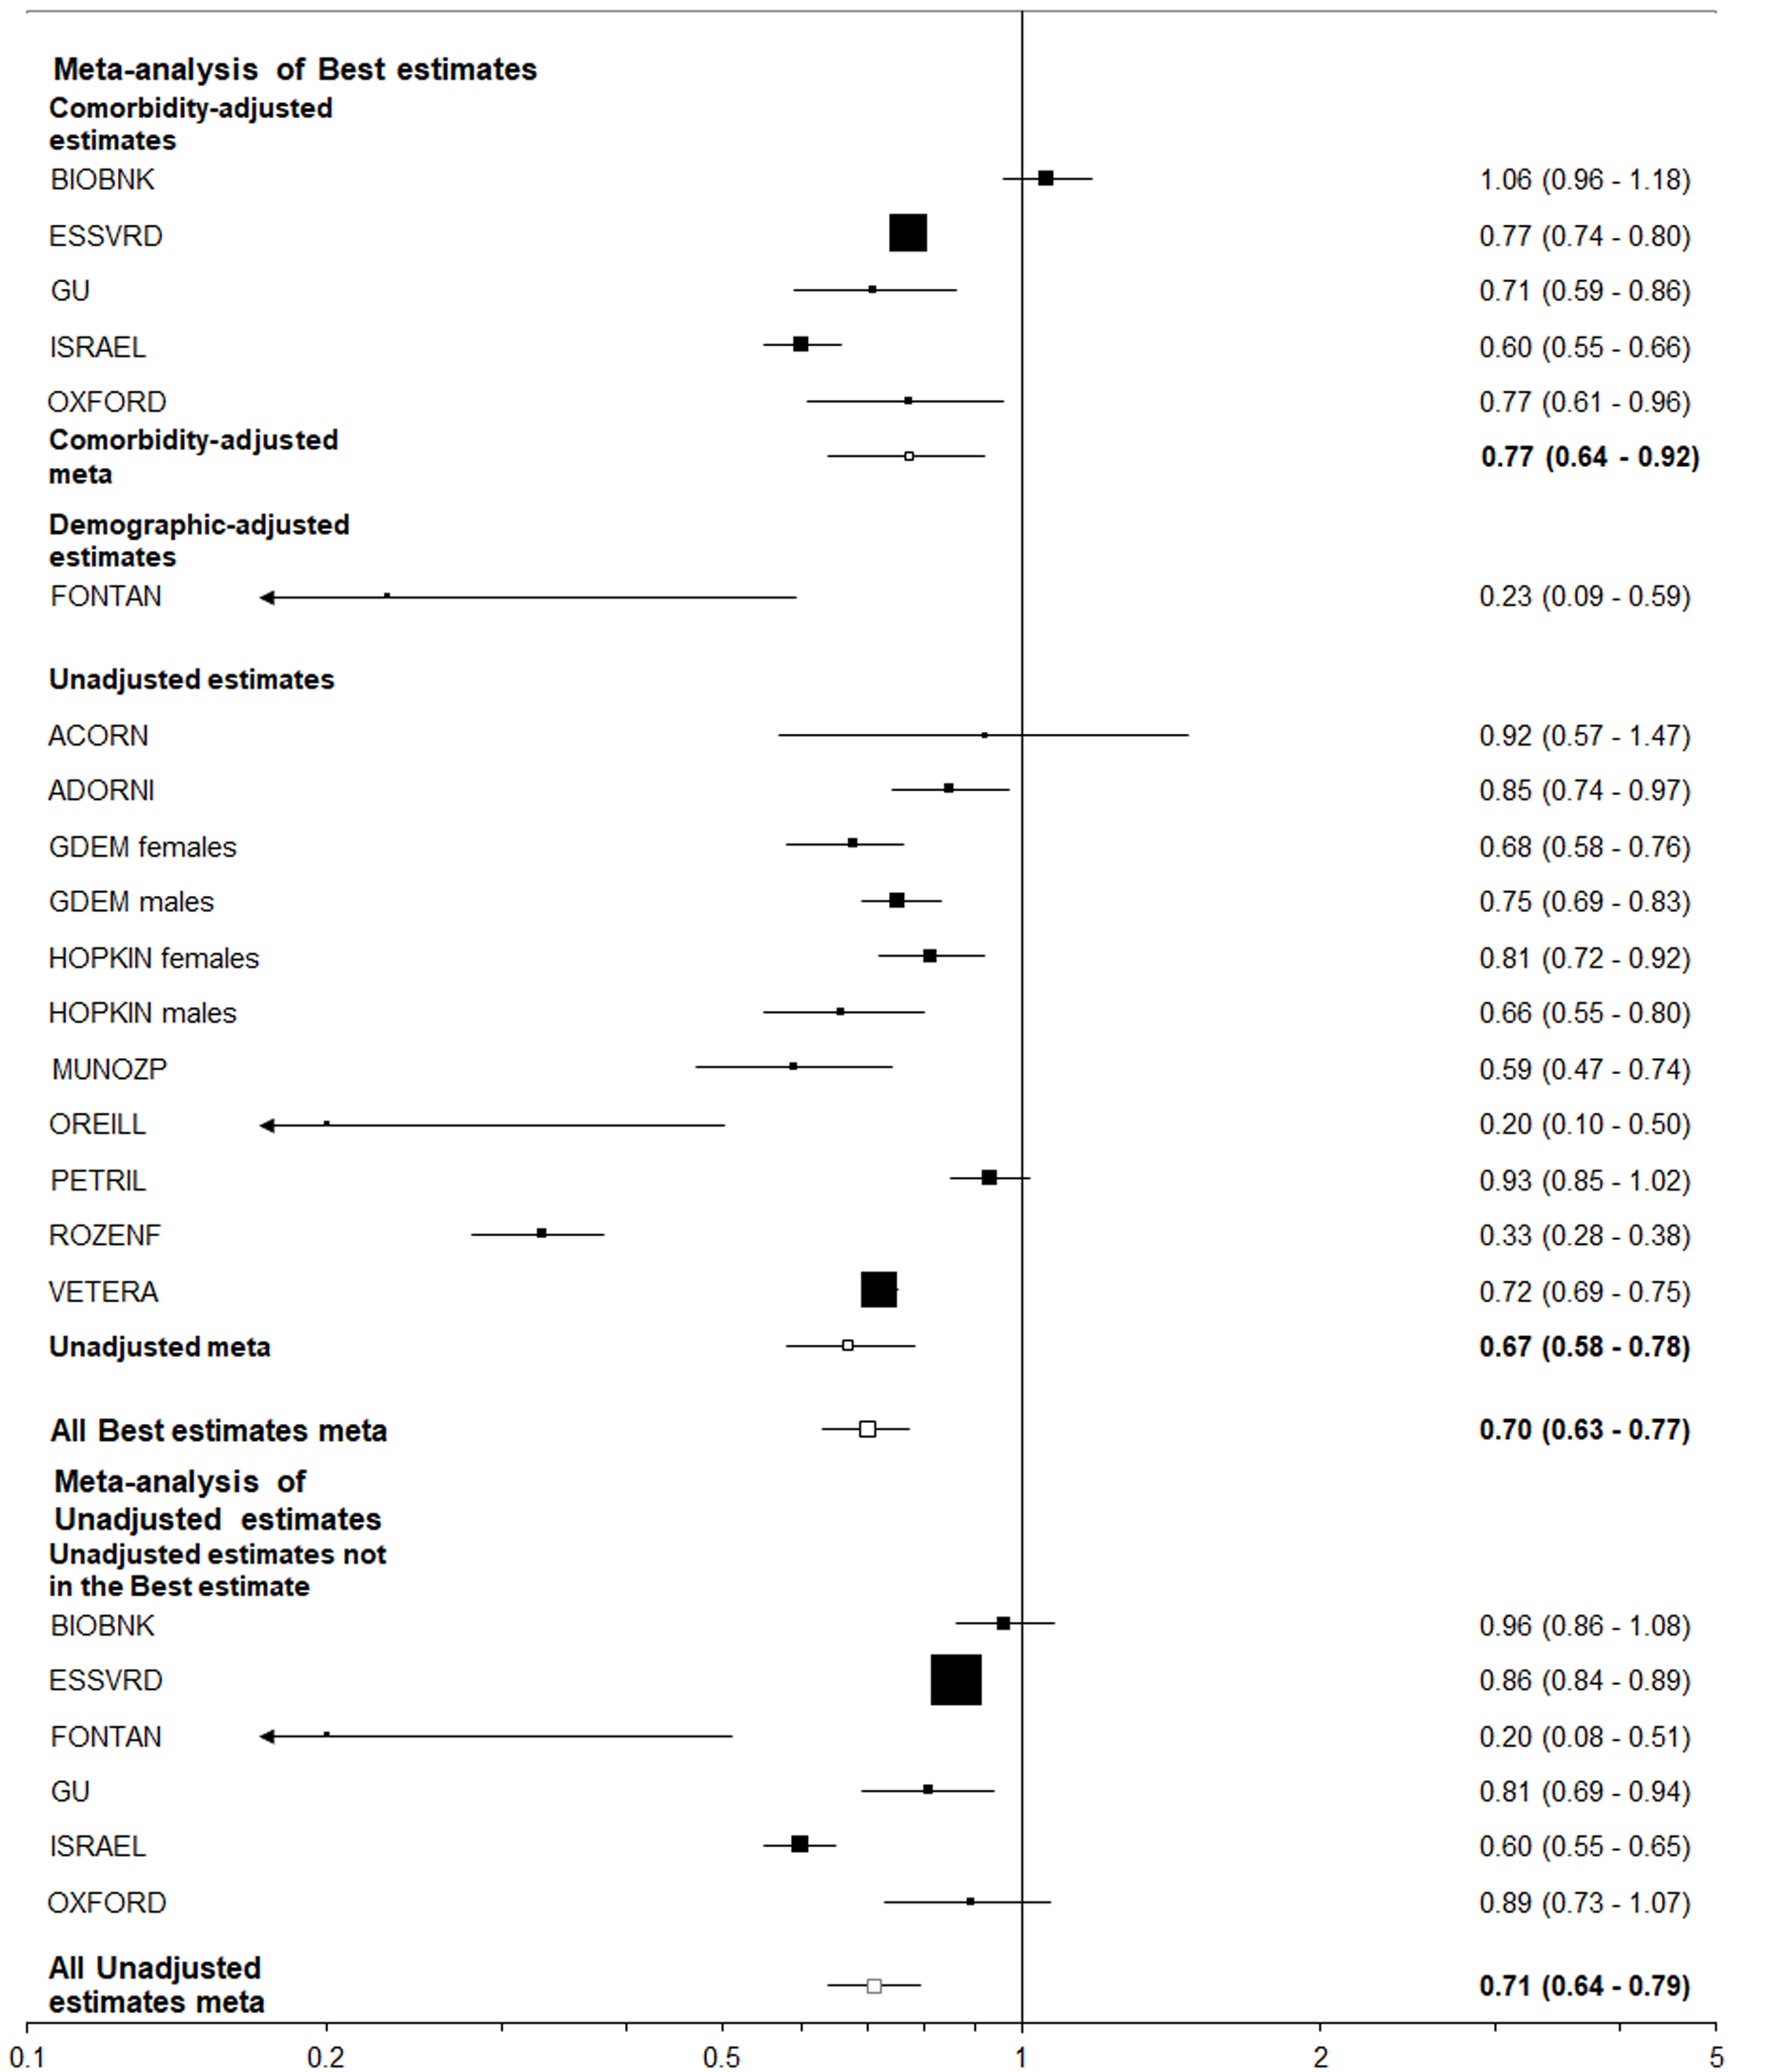
Figure 3 Forest plot of the relationship of the index “closest to ever smoking” to positivity for coronavirus disease 2019 among those tested.
This figure is laid out as described for Figure 2. Estimates from ESSVRD, GDEM and HOPKIN are for current vs non-smokers, from FONTAN and OREILL for smokers (undefined) vs non-smokers, with estimates from the other 10 studies being for ever vs never smokers.
- Citation: Lee PN, Hamling JS, Coombs KJ. Systematic review with meta-analysis of the epidemiological evidence in Europe, Israel, America and Australasia on smoking and COVID-19. World J Meta-Anal 2021; 9(4): 353-376
- URL: https://www.wjgnet.com/2308-3840/full/v9/i4/353.htm
- DOI: https://dx.doi.org/10.13105/wjma.v9.i4.353


