Copyright
©The Author(s) 2017.
World J Meta-Anal. Apr 26, 2017; 5(2): 14-40
Published online Apr 26, 2017. doi: 10.13105/wjma.v5.i2.14
Published online Apr 26, 2017. doi: 10.13105/wjma.v5.i2.14
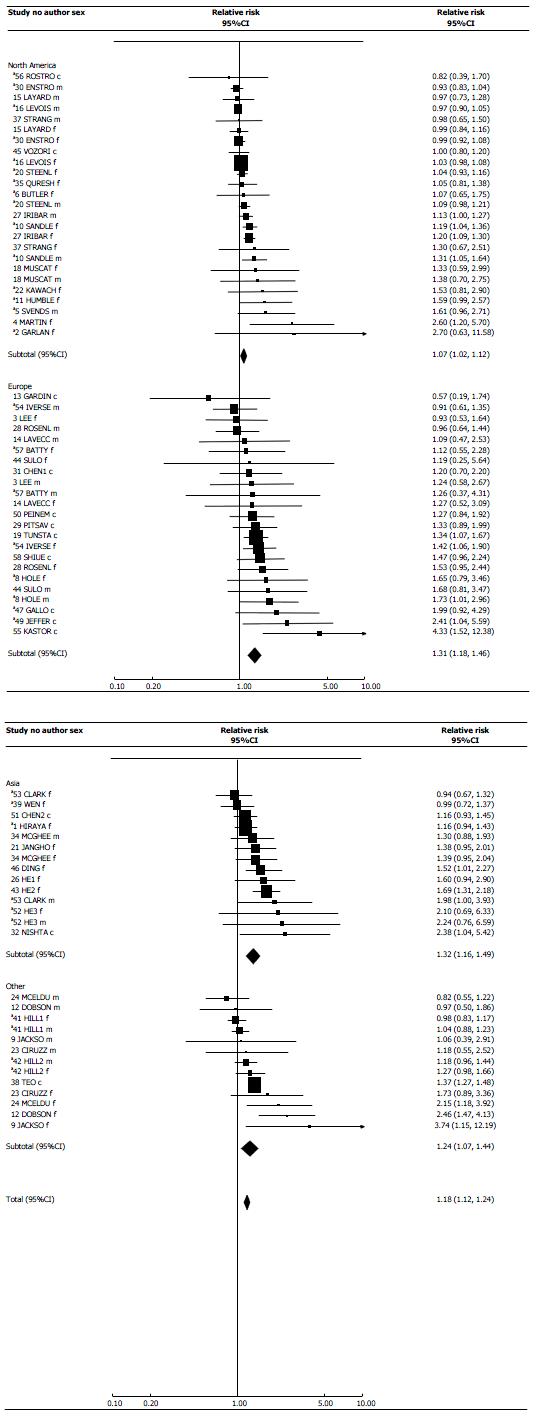
Figure 1 Forest plot for the main index, by continent.
Estimates of the RR and its 95%CI are shown separately by continent, sorted in increasing order of RR. These are shown numerically, and also graphically on a logarithmic scale. Estimates are identified by the study number shown in Table 1, an abbreviation of the author name and the sex to which the estimate relates (m = male, f = female, c = combined sex estimate). In the graphical representation, individual RRs are indicated by a solid square, with the area of the square proportional to the weight (the inverse of the variance of log RR). Arrows warn if the CI goes outside the range of the plot. Random-effects estimates (RRs and their 95%CIs) are shown for each continent and overall, represented graphically by a diamond whose width indicates the confidence interval. aProspective study.
- Citation: Lee PN, Forey BA, Hamling JS, Thornton AJ. Environmental tobacco smoke exposure and heart disease: A systematic review. World J Meta-Anal 2017; 5(2): 14-40
- URL: https://www.wjgnet.com/2308-3840/full/v5/i2/14.htm
- DOI: https://dx.doi.org/10.13105/wjma.v5.i2.14


