Copyright
©The Author(s) 2019.
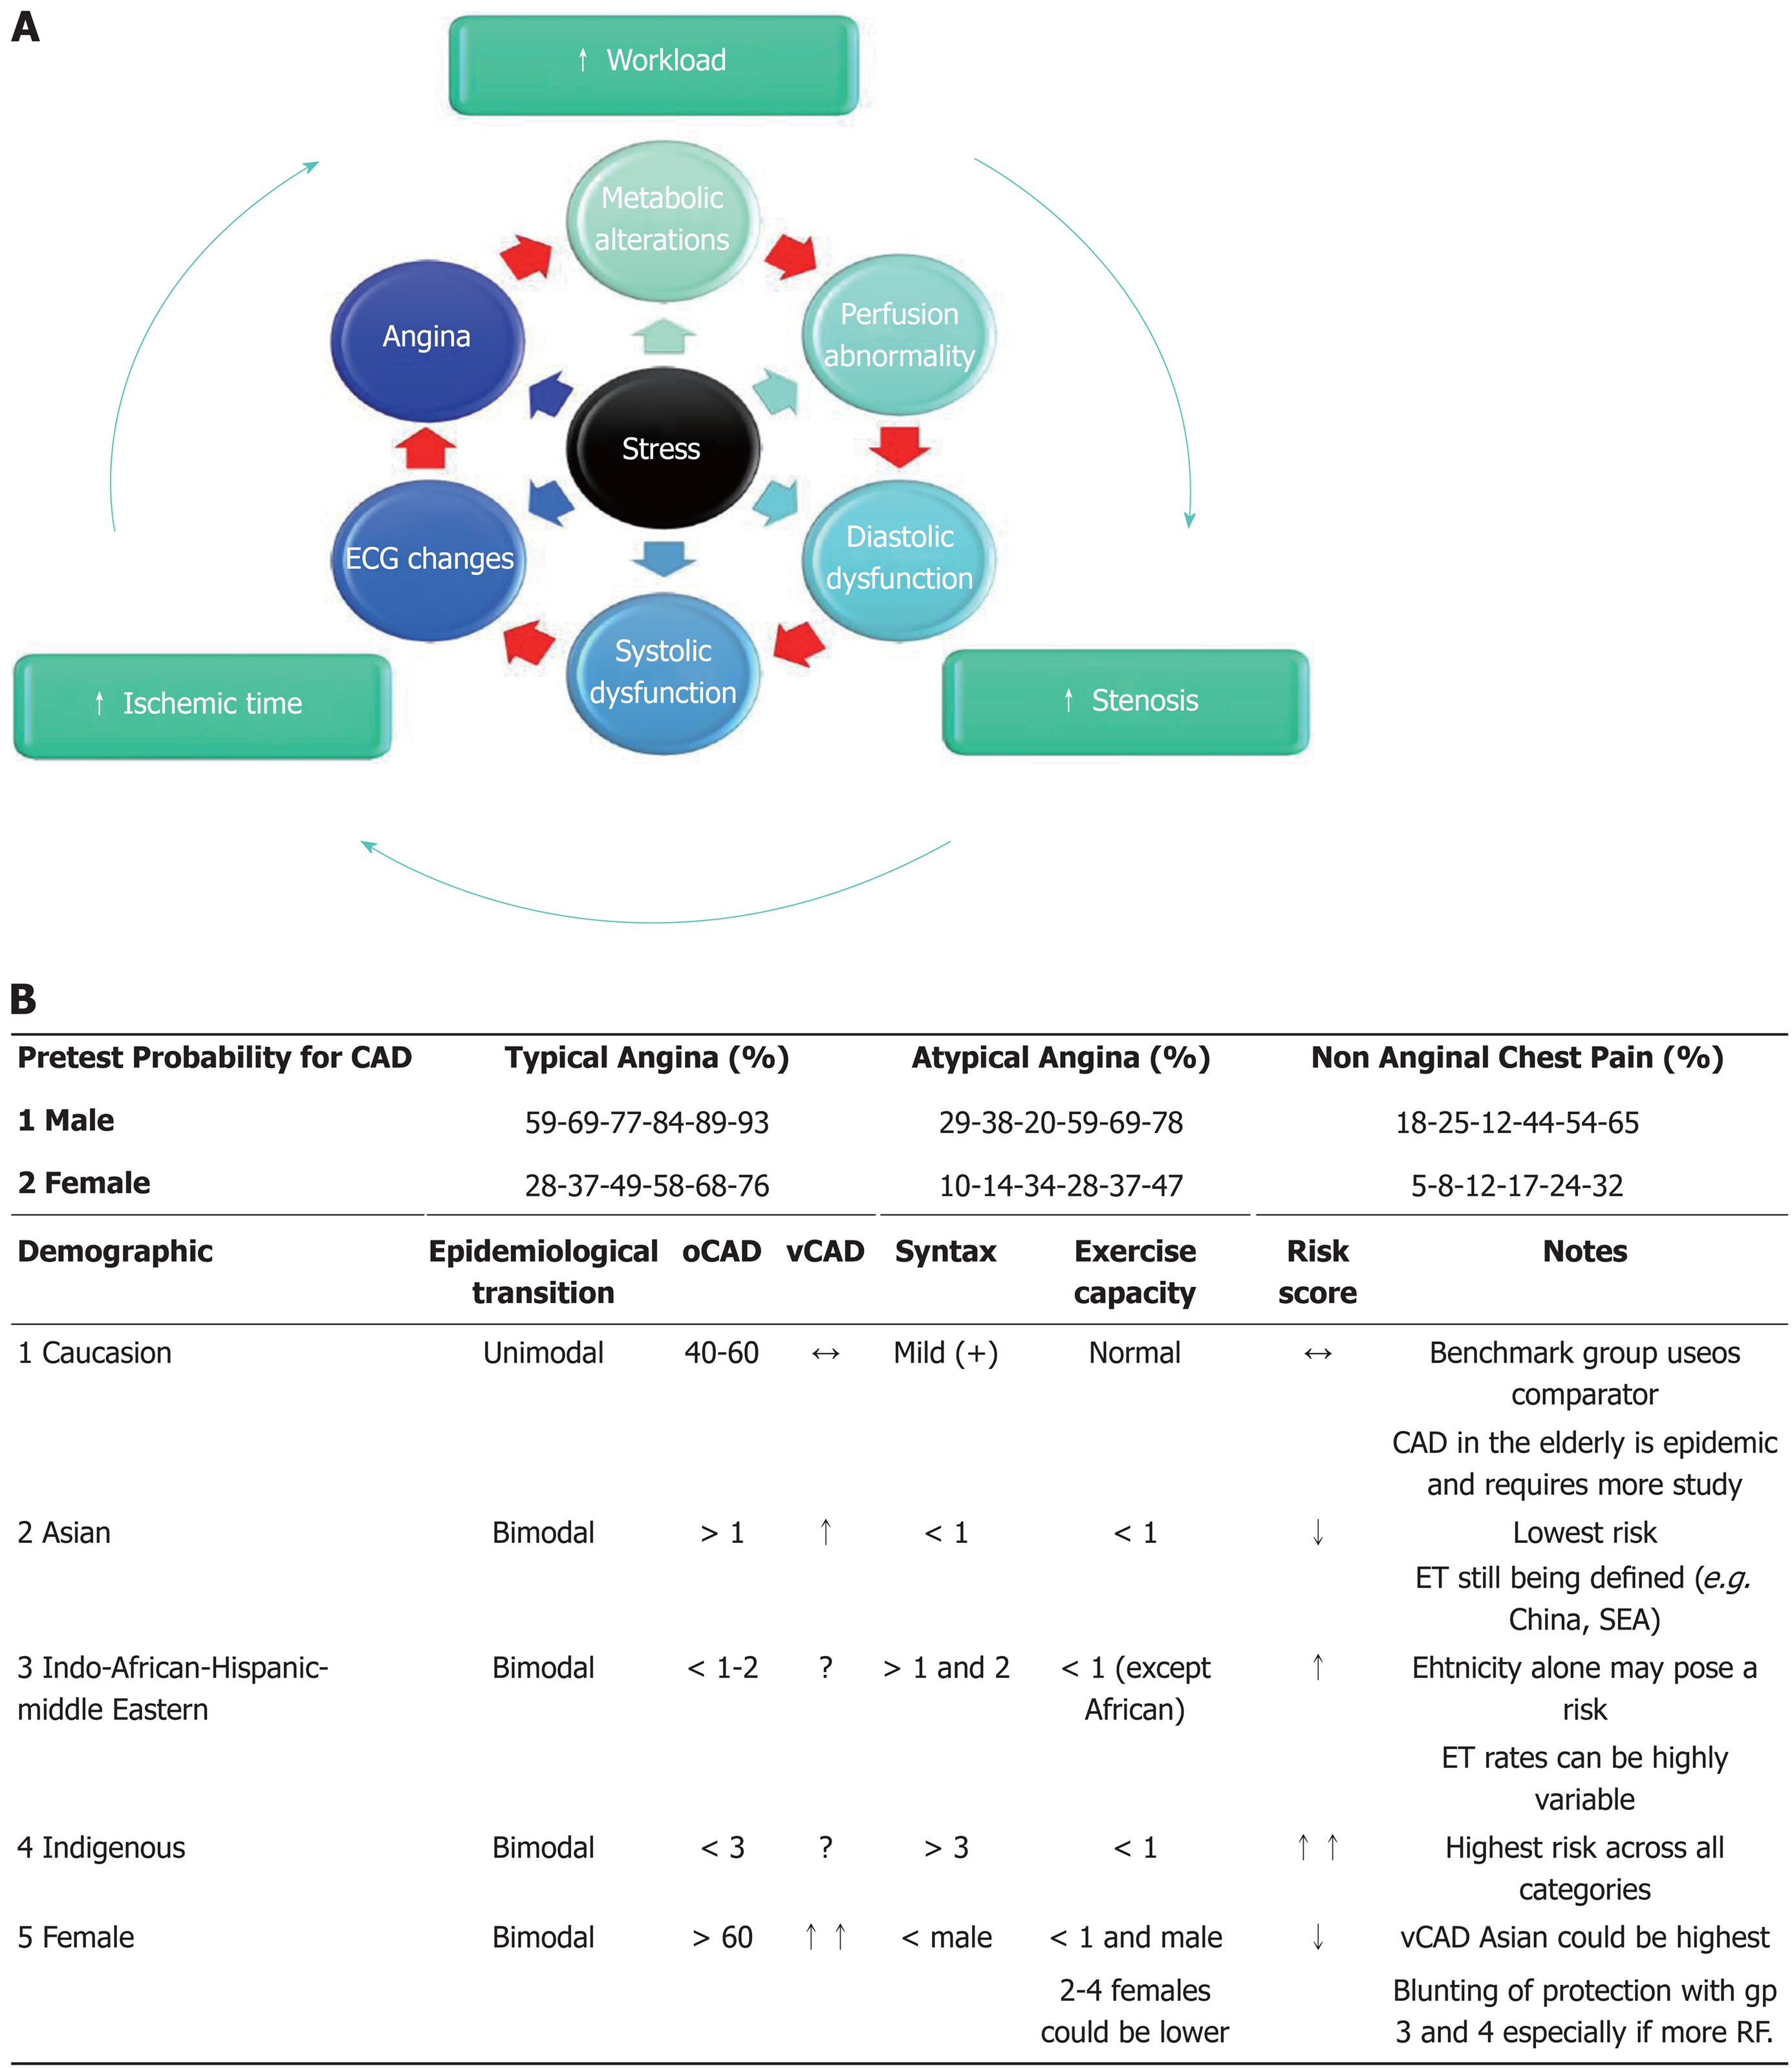
Figure 3 Ischemic Cascade and Constellation in clinical context.
A: Stress creates myocardial energy imbalance leading to any of six manifestations in the ichemic cascade (red arrow) in a forward linear direction. Individual variations and combinations of workload, stenosis severity and ischemia duration (outer green arrows) that inlfuences the order for components in the cascde, creates more reaslistically an ischemic constellation’ of events, where any order for observable events is possilbe (multicolour arrows); B: PTP guides diagnostic workup. The probability is never 0 or 100%. With < 15 and > 85% guiding low or high risk. The actual number are for age range 30-39 years, increasing by decades, to > 80 years. Variations from the mean are determined by demography. No 1-4 represent males. Females across all groups represent the same CAD risk as the males except are relatively protected during middle ages, delaying mean onset of significant CAD. Etiological variations exist in: (1) vasospasm, being more likely in women, especially Asian. The actual rates among other non-caucasion female races are nor well defined; (2) gender protection: from premature CAD in women may also be blunted in higher risk groups 2; (3) ethnicity - Aboriginal populations suffer from the greatest risk and severity of CAD, followed by 3, 1 and 2. Asians have the lowest risks; (4) developmental status - of any group also lowers mean age of onset of any ethnicity. Defining the coronary anatomy early could be one way of risk stratifying subgroups within braod ethnic based categories. oCAD: Obstructive coronary artery disease; ET: Epidemiological transition; PTP: Pre-test probablity; RF: Risk factors; SEA: South East Asia; vCAD: Vasospastic coronary artery disease. (Concepts modified from ref 38, 39, 82-101).
- Citation: Iyngkaran P, Chan W, Liew D, Zamani J, Horowitz JD, Jelinek M, Hare DL, Shaw JA. Risk stratification for coronary artery disease in multi-ethnic populations: Are there broader considerations for cost efficiency? World J Methodol 2019; 9(1): 1-19
- URL: https://www.wjgnet.com/2222-0682/full/v9/i1/1.htm
- DOI: https://dx.doi.org/10.5662/wjm.v9.i1.1


