Copyright
©The Author(s) 2016.
World J Crit Care Med. Feb 4, 2016; 5(1): 7-11
Published online Feb 4, 2016. doi: 10.5492/wjccm.v5.i1.7
Published online Feb 4, 2016. doi: 10.5492/wjccm.v5.i1.7
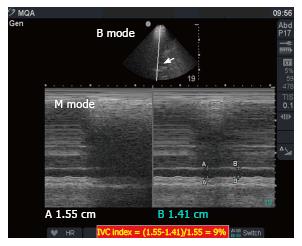
Figure 5 Two point five liters of crystalloids were given to the previous patient over 35 min and repeated measurements of the inferior vena cava diameter were performed.
The upper image is a transverse cross sectional B mode showing the IVC (white arrow). The lower image is an M mode showing that the IVC increased to a maximum 1.55 cm with an IVC index of 9% [(1.55-1.41)/1.55]. A-A in the M mode represents the maximum IVC diameter while B-B represents the minimum IVC diameter. IVC: Inferior vena cava.
- Citation: Abu-Zidan FM. Optimizing the value of measuring inferior vena cava diameter in shocked patients. World J Crit Care Med 2016; 5(1): 7-11
- URL: https://www.wjgnet.com/2220-3141/full/v5/i1/7.htm
- DOI: https://dx.doi.org/10.5492/wjccm.v5.i1.7


