Copyright
©The Author(s) 2015.
World J Crit Care Med. Nov 4, 2015; 4(4): 287-295
Published online Nov 4, 2015. doi: 10.5492/wjccm.v4.i4.287
Published online Nov 4, 2015. doi: 10.5492/wjccm.v4.i4.287
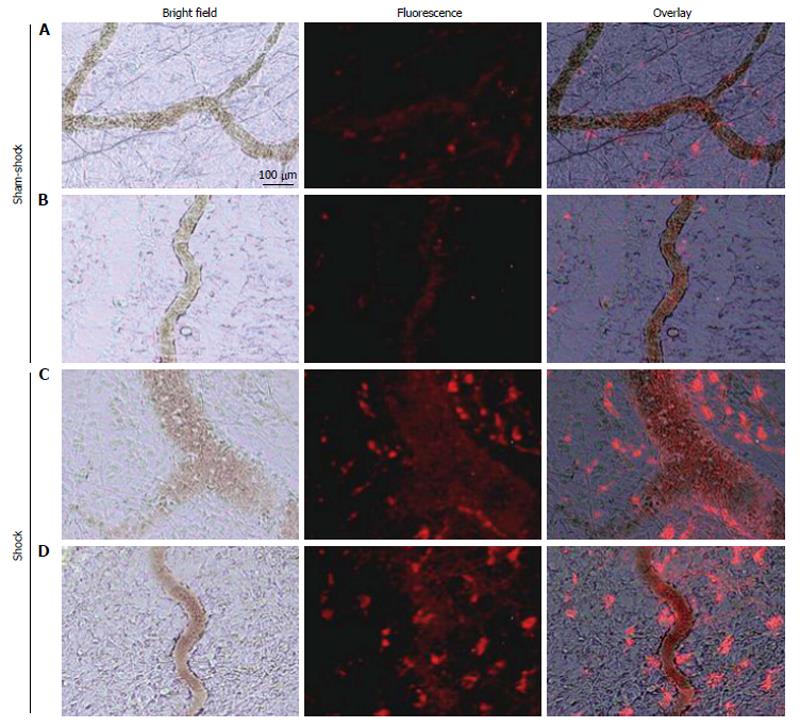
Figure 2 Selected in vivo microvascular images from two different sham-shock control (A and B) and shock (C and D) animals (n = 6, both groups) after hemorrhagic shock or sham-shock and reperfusion.
Note the significantly higher levels of red fluorescent casein-derived peptides in the microvasculature and within the interstitium in shock animals (C and D) compared with their sham shock counterparts (A and B).
-
Citation: Alsaigh T, Chang M, Richter M, Mazor R, Kistler EB.
In vivo analysis of intestinal permeability following hemorrhagic shock. World J Crit Care Med 2015; 4(4): 287-295 - URL: https://www.wjgnet.com/2220-3141/full/v4/i4/287.htm
- DOI: https://dx.doi.org/10.5492/wjccm.v4.i4.287


