Copyright
©The Author(s) 2025.
World J Crit Care Med. Sep 9, 2025; 14(3): 107513
Published online Sep 9, 2025. doi: 10.5492/wjccm.v14.i3.107513
Published online Sep 9, 2025. doi: 10.5492/wjccm.v14.i3.107513
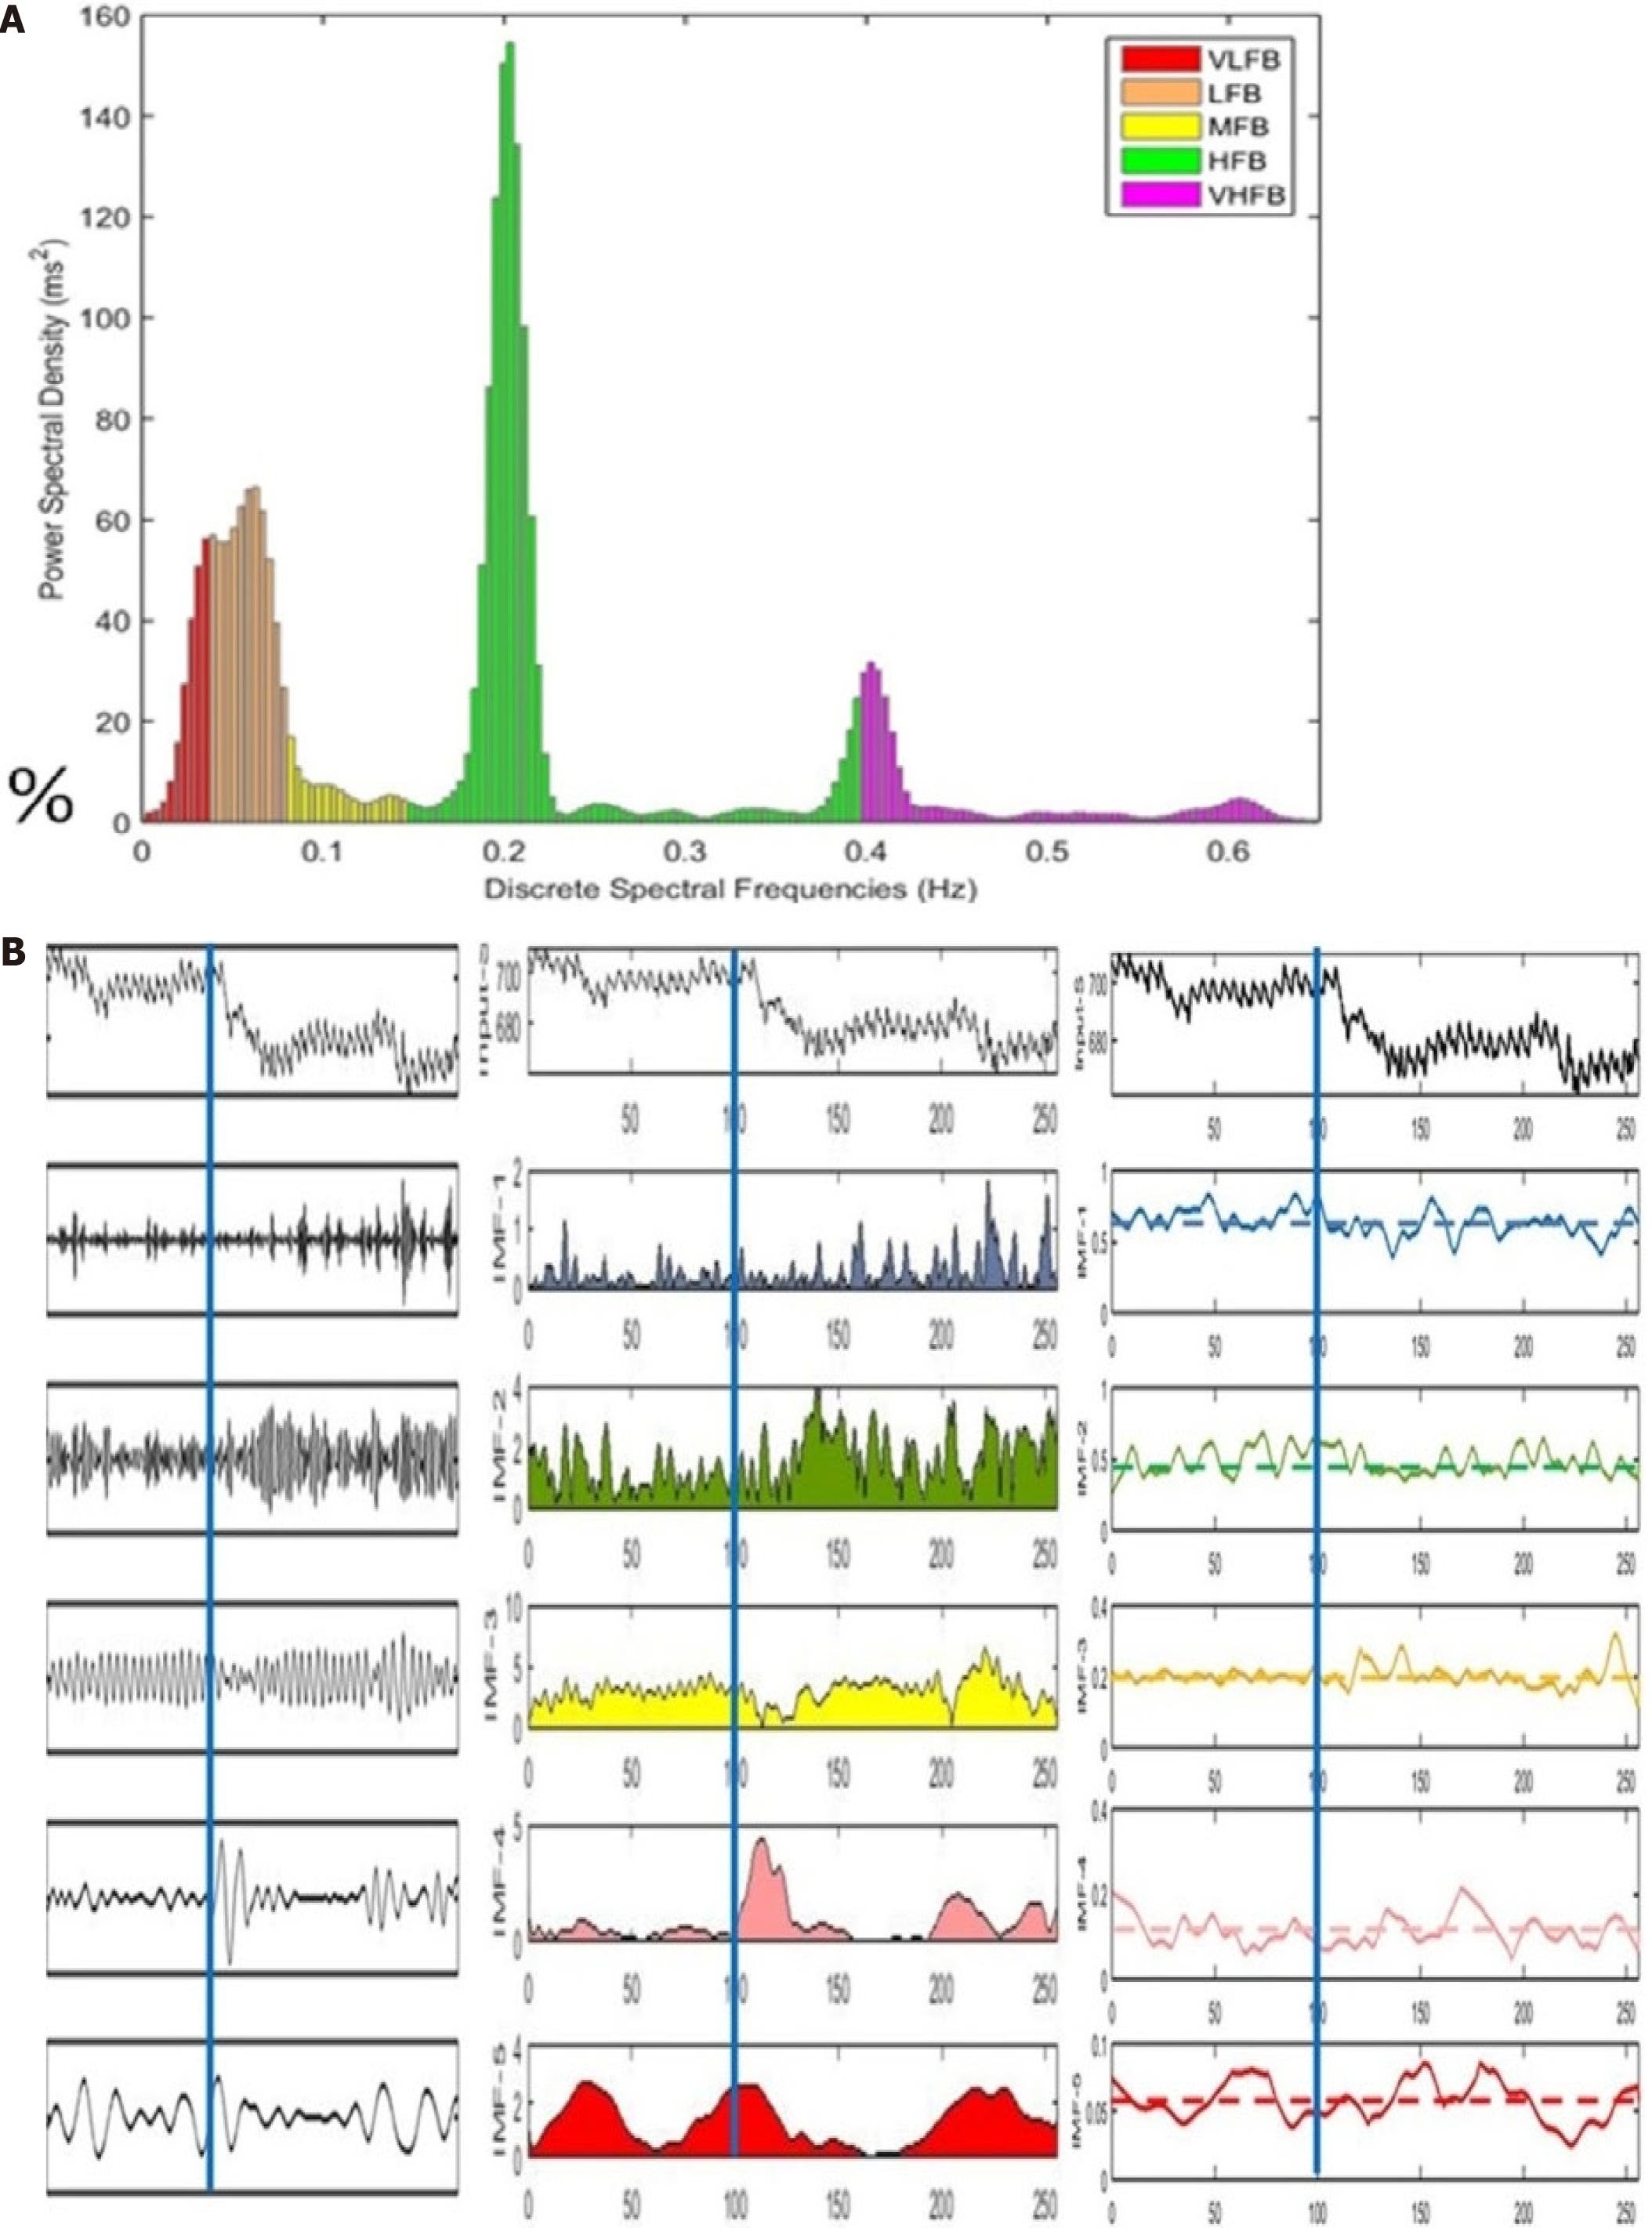
Figure 4 Autonomic nervous system assessment of Jahi McMath by heart rate variability comparing basal record vs “mother talks stimulus”.
A: The figure shows the heart rate variability (HRV) power spectral density spectrum. Spectral frequencies within the very low frequency, low frequency, middle frequency, and high frequency bands are present (upper panel). The bottom panel shows the power spectral density values expressed as normalized (%) values. Normalized values show a predominance of the band; B: The figure shows the valid intrinsic mode functions (IMFs) (left panel), the instantaneous spectral amplitudes (middle panel), and the instantaneous frequency (right panel) values of the respective IMFs. The Tacograms are presented in the first diagrams of the three panels. Non-continued lines indicate the instantaneous frequency's mean values (right panel). A thick blue vertical line indicates the beginning of the "Mother Talks" stimulus vs the "Basal Record." Comparing both experimental conditions, a seeming dynamic in the different HRV frequencies is present. Citation: Machado C. The Jahi McMath Case: First Detailed Study of Her Brain. Neurol India 2022; 70(5): 2235-2236. Copyright ©The Author(s) 2022. Published by Wolters Kluwer – Medknow[14]”. VLFB: Very low frequency band; LFB: Low frequency band; MFB: Middle frequency band; HFB: High frequency band; VHFB: Very high frequency band.
- Citation: Machado C. Jahi McMath case: A comprehensive and updated narrative. World J Crit Care Med 2025; 14(3): 107513
- URL: https://www.wjgnet.com/2220-3141/full/v14/i3/107513.htm
- DOI: https://dx.doi.org/10.5492/wjccm.v14.i3.107513


