Copyright
©The Author(s) 2019.
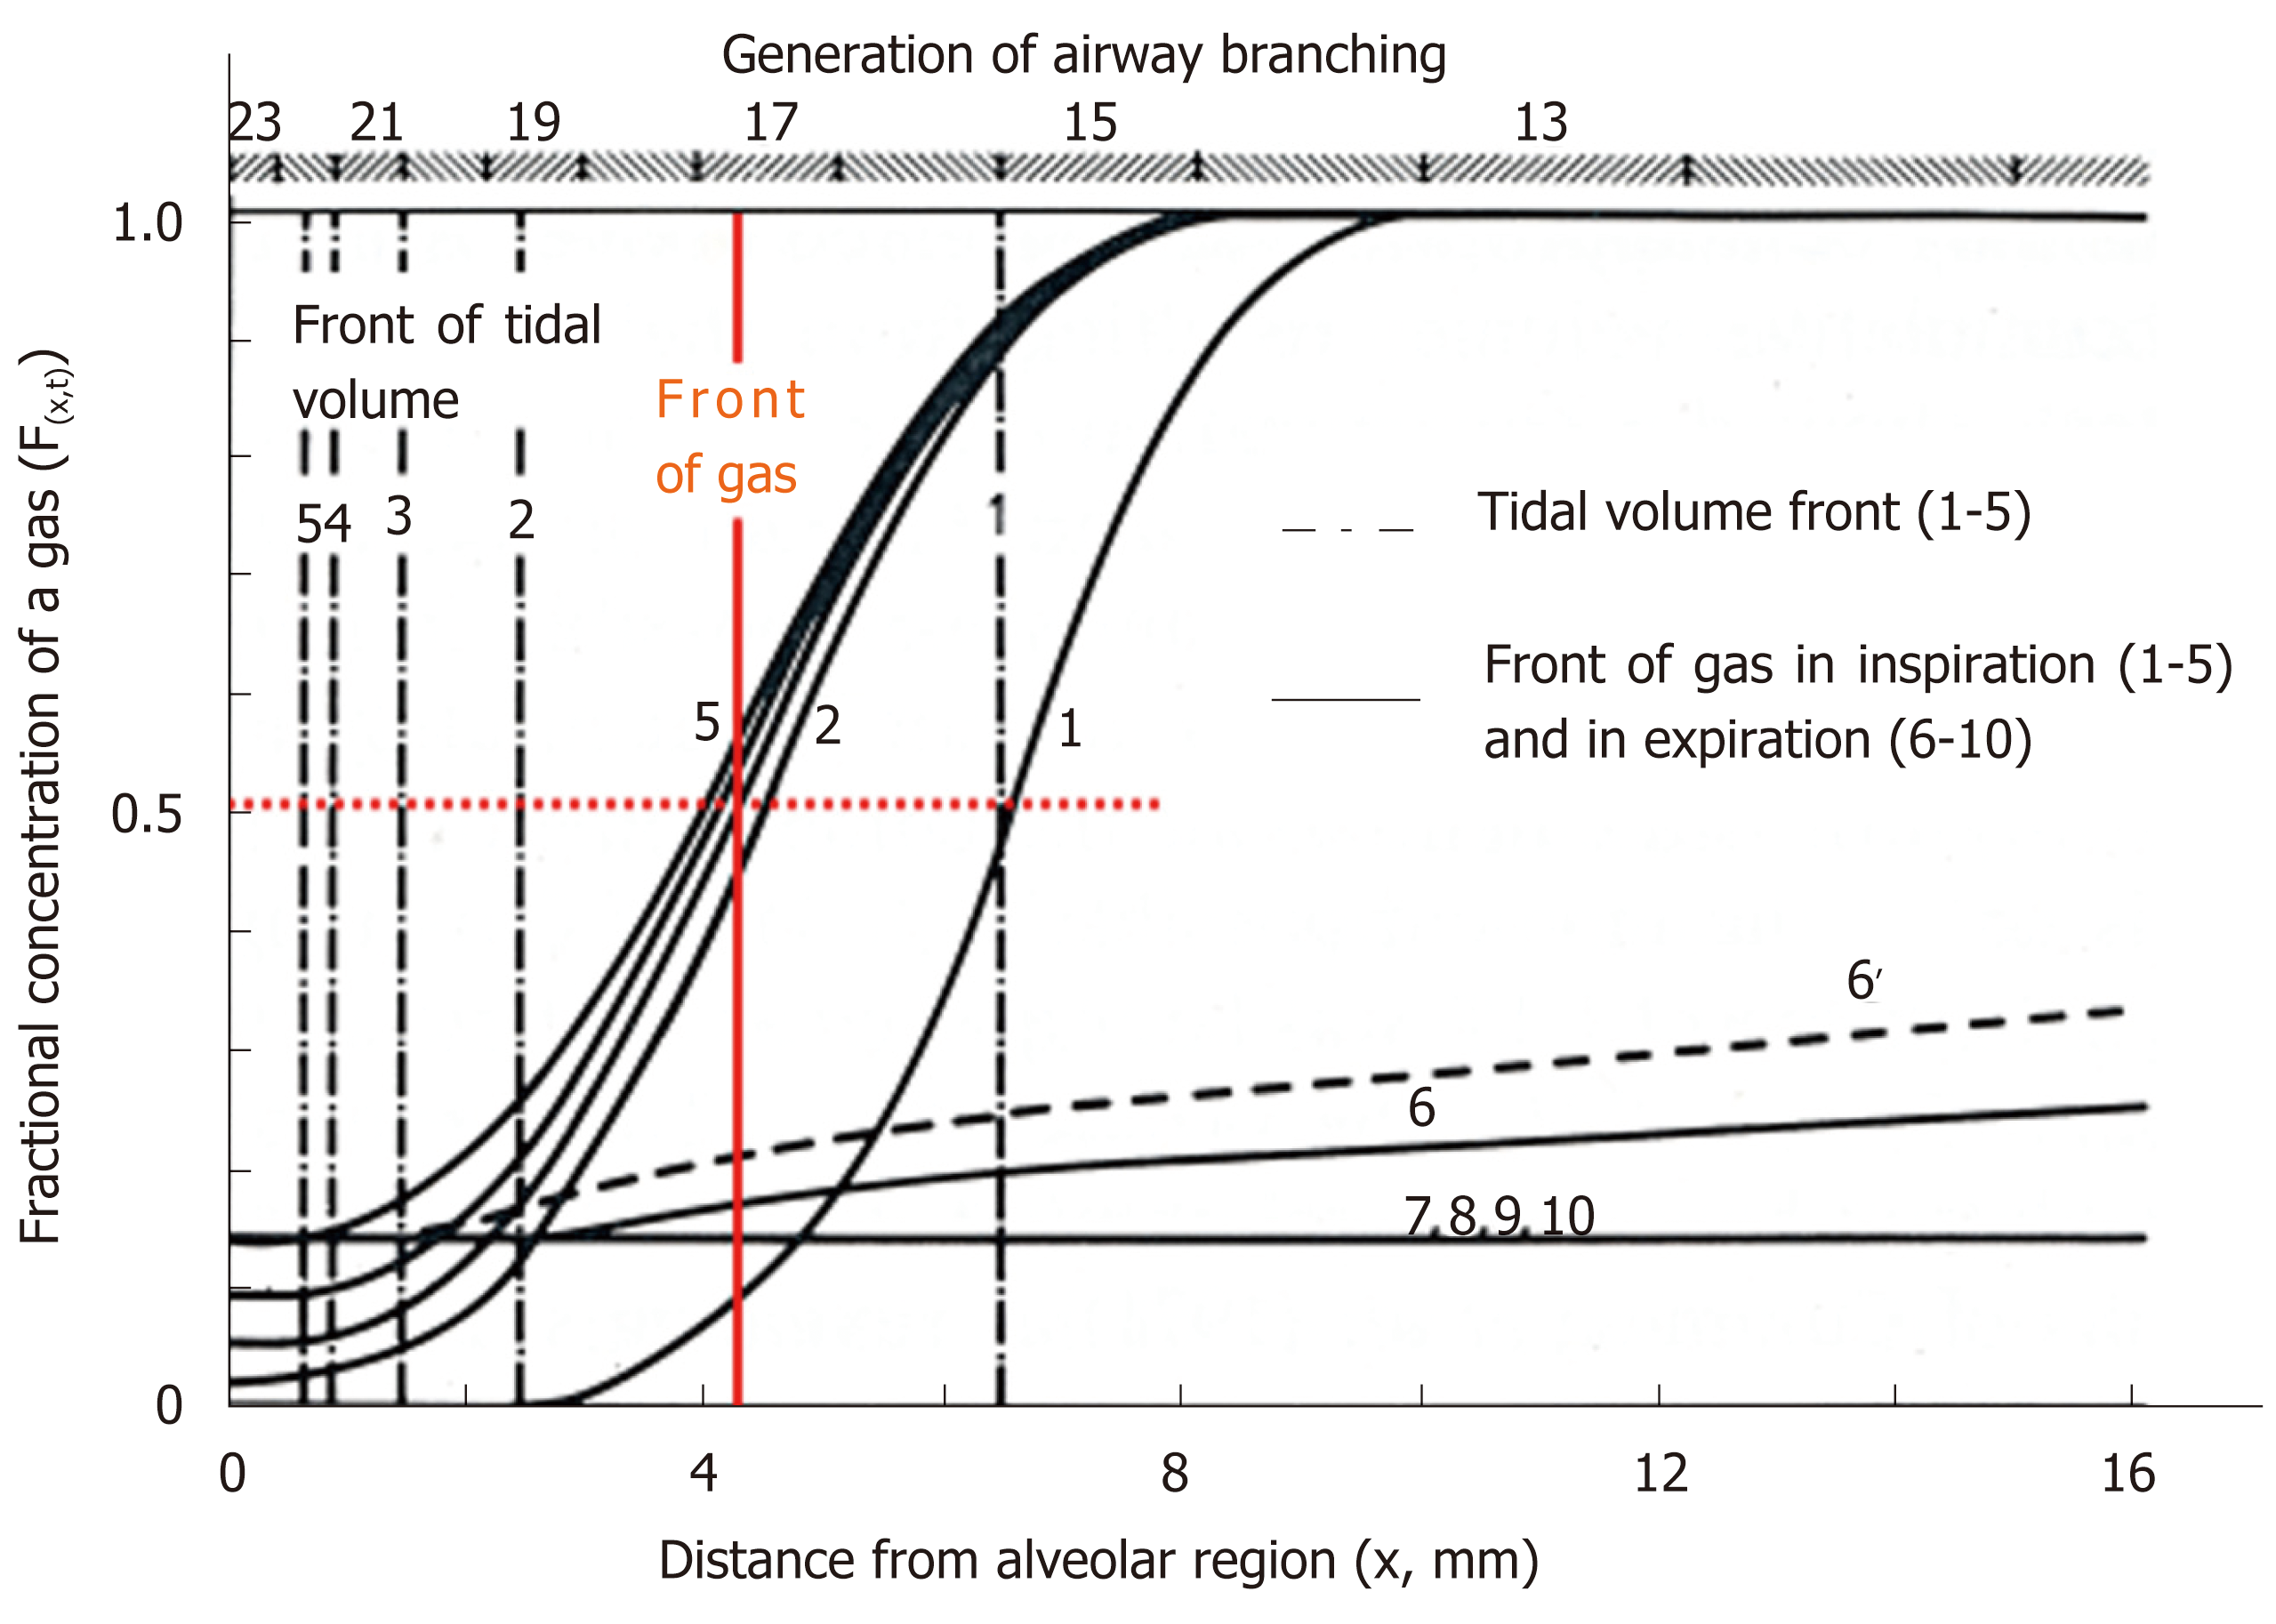
Figure 4 Concentration profiles along peripheral conducting airways and acinar airways during the respiratory cycle in thumbtack model.
Upper abscissa: generation of airway branching defined in model A of Weibel. Lower abscissa: axial distance from alveolar region. Ordinate: fractional concentration of the test gas. 100% O2 is inhaled (single breath) into and then exhaled from initially O2-free lung with constant flow (tidal volume: 500 mL) and constant lung volume (functional residual capacity: 3000 mL). O2 is assumed to not be absorbed into capillary blood (i.e., no gas exchange). Solid curves (black) indicate concentration profiles at successive equally timed periods during inspiration (1-5) and expiration (6-10). Dashed dotted lines (1-5) are tidal volume fronts (i.e., concentration fronts of non-diffusible tracer gas) during inspiration. Dashed line (6’) is a concentration profile calculated on assumption of no axial diffusion during expiratory phase corresponding to time point of solid line (6). Red solid line denotes “imaginary” boundary between common dead space and alveolar region conceptualized in classical gas-exchange theory. Boundary is defined by stationary gas front converting diffusional effect into equivalent convectional effect, which is formed at entrance of acinus of Aschoff (17th generation of branching tree). See text for detailed explanation. Modified from ref[46].
- Citation: Yamaguchi K, Tsuji T, Aoshiba K, Nakamura H, Abe S. Anatomical backgrounds on gas exchange parameters in the lung. World J Respirol 2019; 9(2): 8-29
- URL: https://www.wjgnet.com/2218-6255/full/v9/i2/8.htm
- DOI: https://dx.doi.org/10.5320/wjr.v9.i2.8


