Copyright
©The Author(s) 2018.
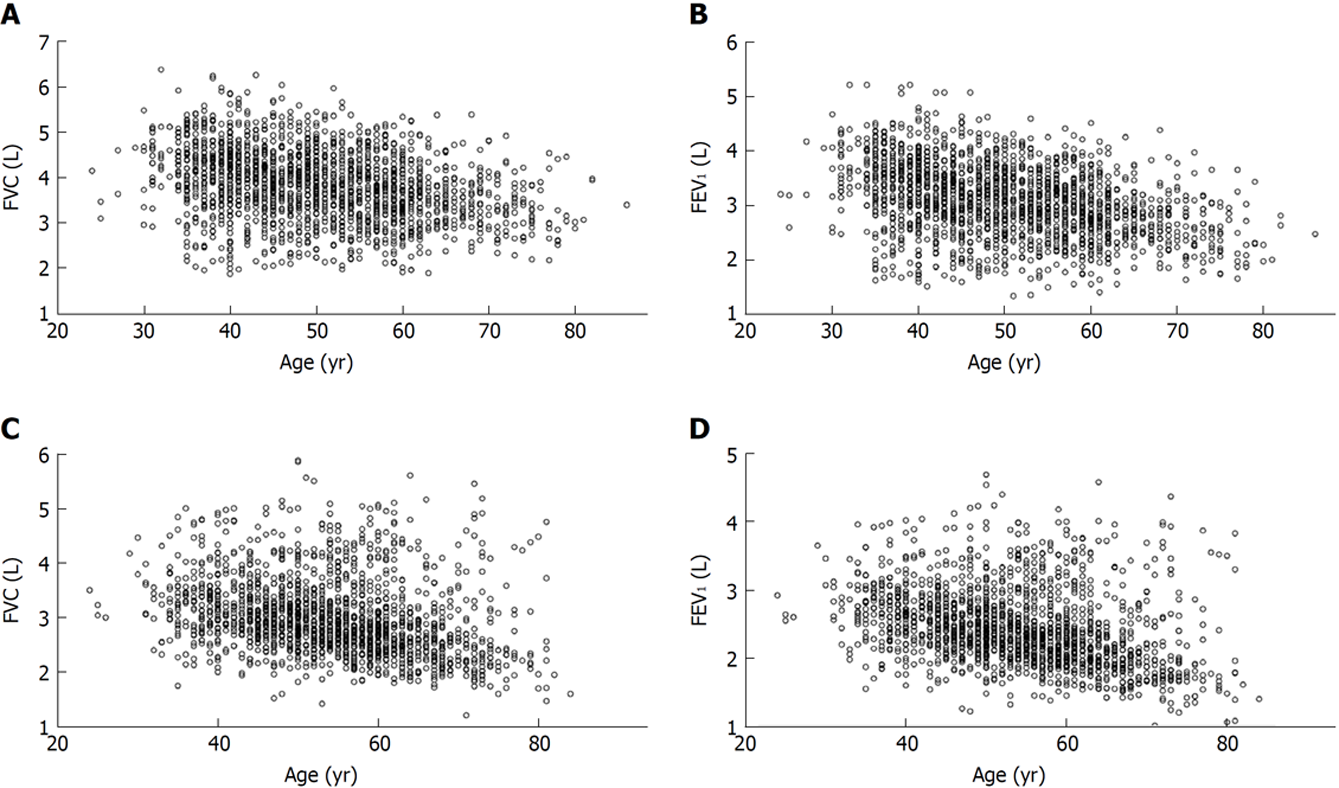
Figure 1 Distributions of measured forced vital capacity and forced expiratory volume after one second along age axis in cohort A.
A: Forced vital capacity (FVC) in men; B: Forced expiratory volume after one second (FEV1) in men; C: FVC in women; D: FEV1 in women.
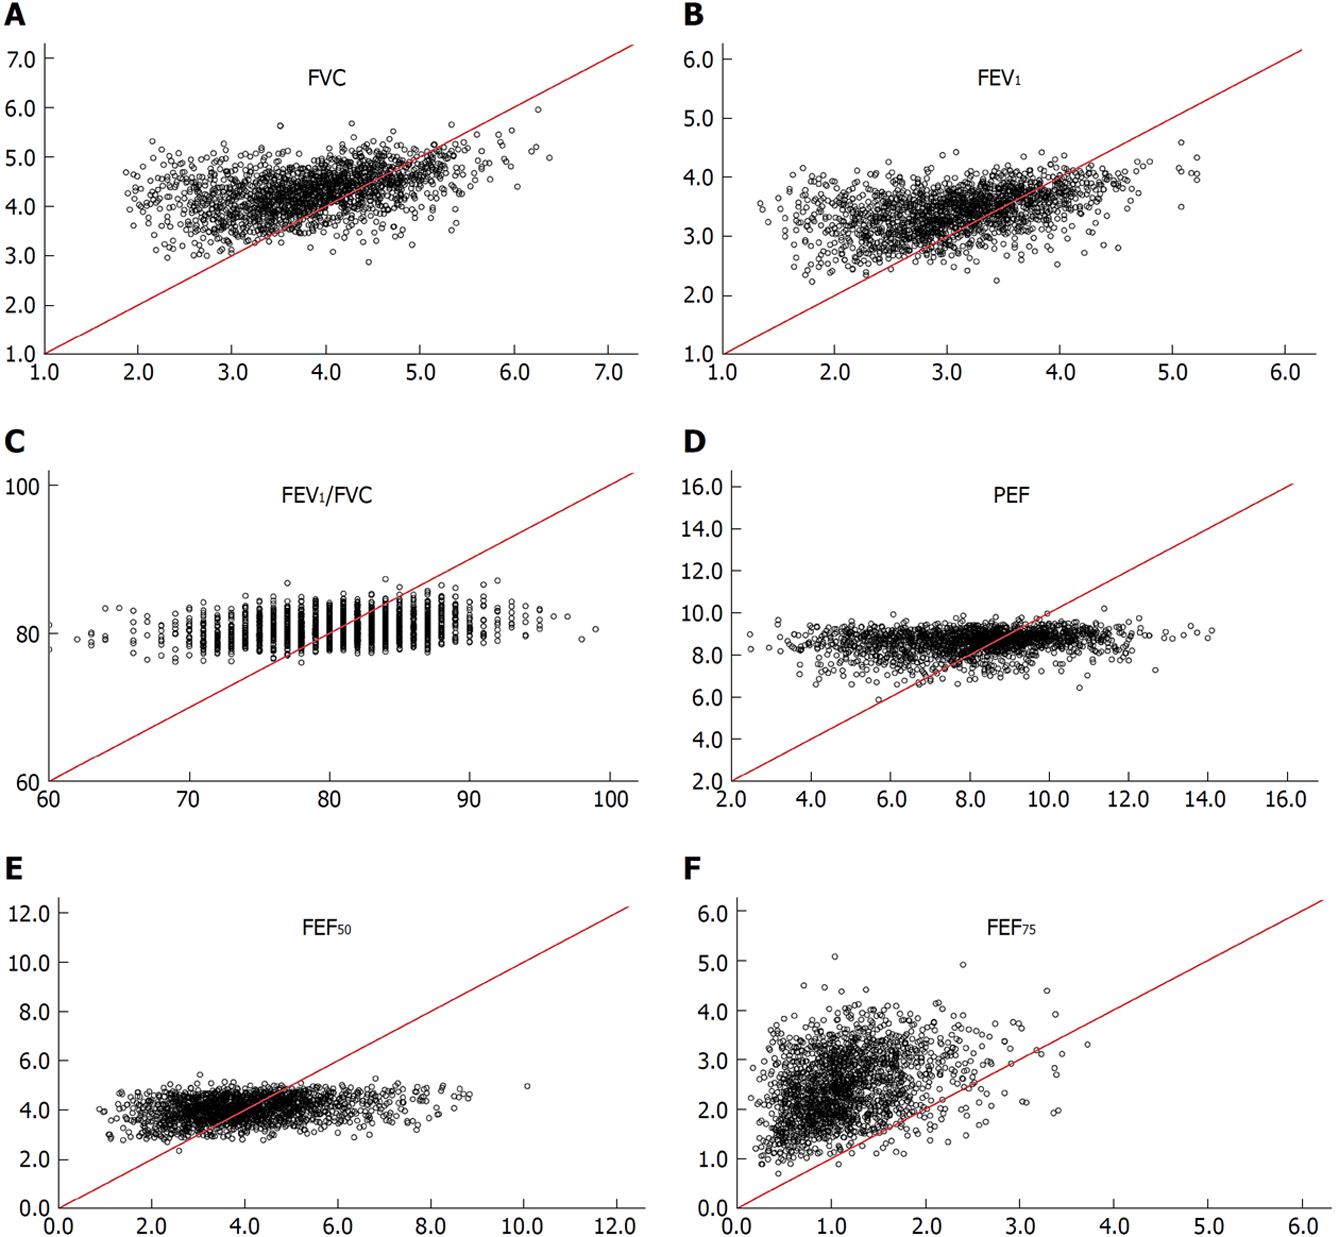
Figure 2 Comparison of measured spirometric parameters of men in cohort A and reference means calculated from regression equations constructed for non-adipotic men.
Horizontal axis: Measured values; Vertical axis: Values predicted from the non-adipotic regression equation[13]; Red line: Line on identity. FVC: Forced vital capacity; PEF: Peak expiratory flow; FEV1: Forced expiratory volume after one second.
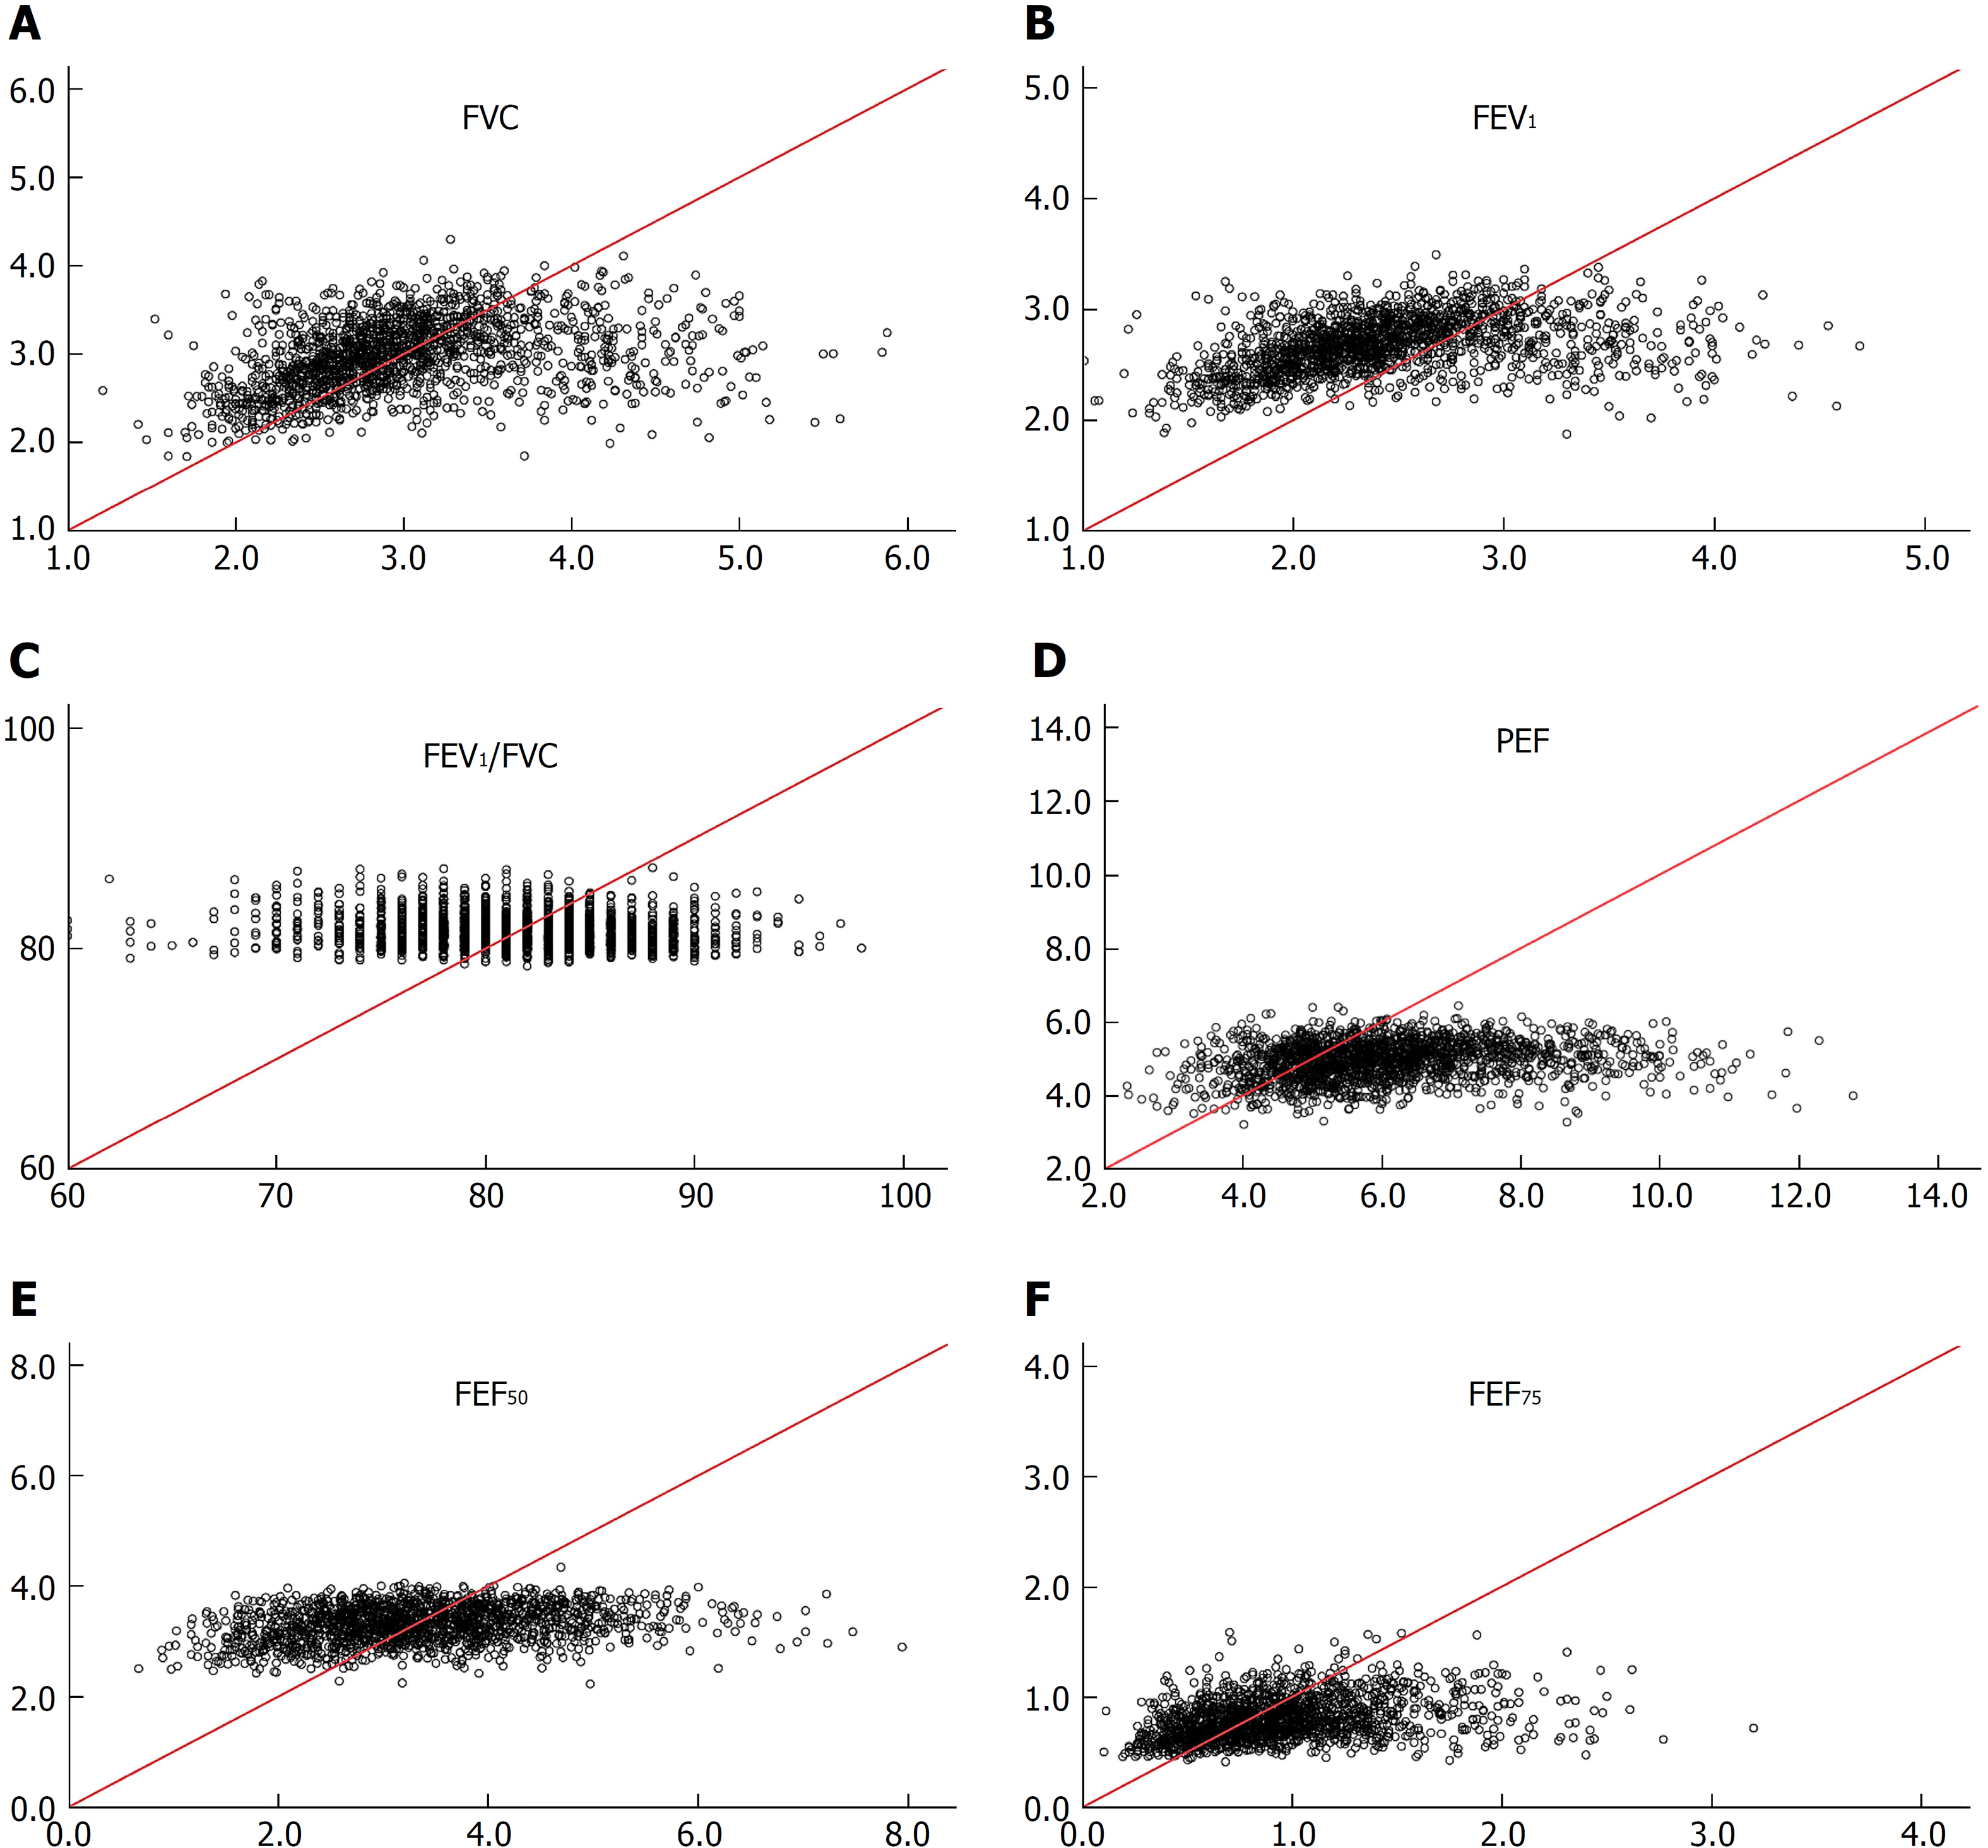
Figure 3 Comparison of measured spirometric parameters of women in cohort A and reference means calculated from regression equations constructed for non-adipotic women.
Horizontal axis: Measured values; Vertical axis: Values predicted from the non-adipotic regression equation[13]; Red line: Line on identity. FVC: Forced vital capacity; PEF: Peak expiratory flow; FEV1: Forced expiratory volume after one second.
- Citation: Yamaguchi K, Omori H, Tsuji T, Aoshiba K. Classical regression equations of spirometric parameters are not applicable for diagnosing spirometric abnormalities in adipotic adults. World J Respirol 2018; 8(1): 1-12
- URL: https://www.wjgnet.com/2218-6255/full/v8/i1/1.htm
- DOI: https://dx.doi.org/10.5320/wjr.v8.i1.1


