
















©The Author(s) 2017.
World J Orthop. Jun 18, 2017; 8(6): 484-490
Published online Jun 18, 2017. doi: 10.5312/wjo.v8.i6.484
Published online Jun 18, 2017. doi: 10.5312/wjo.v8.i6.484
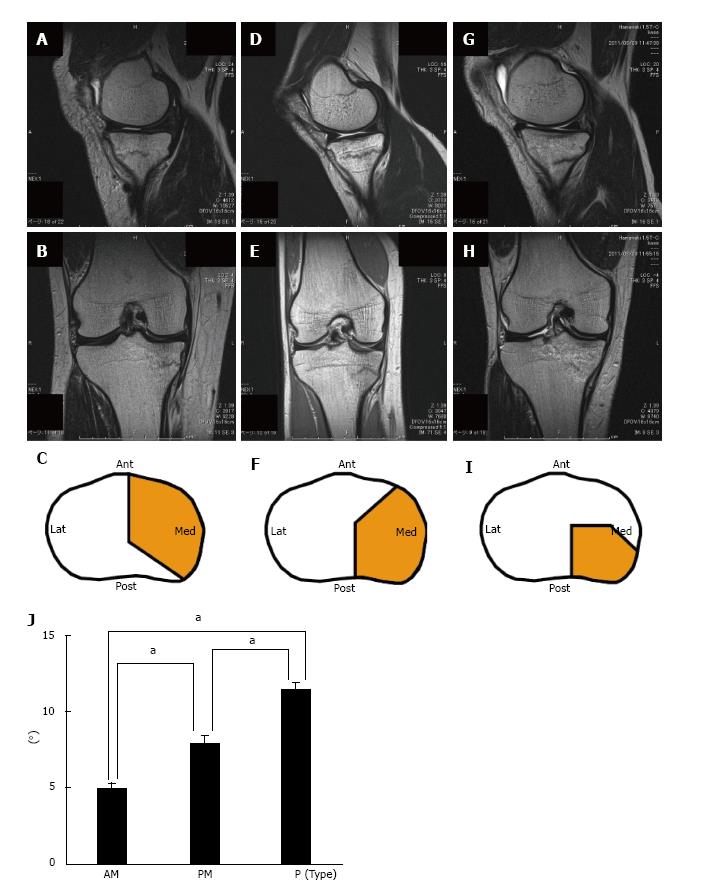
Figure 3 Representative magnetic resonance imaging of T2-weighted sagittal (A, D, and G) and coronal (B, E, and H) views in the anteromedial (AM), posteromedial (PM), posterior (P) types of medial tibial plateau stress fractures.
Illustrative diagrams of the fracture area (orange) of AM (C), PM (F), and P (I) types at the tibial plateau. Ant: Anterior; Lat: Lateral; Med: Medial; Post: Posterior. J: Relationship between fracture location and posterior tibial slope of the medial tibial plateau. Error bar indicates standard error, aP < 0.05.
- Citation: Yukata K, Yamanaka I, Ueda Y, Nakai S, Ogasa H, Oishi Y, Hamawaki JI. Medial tibial plateau morphology and stress fracture location: A magnetic resonance imaging study. World J Orthop 2017; 8(6): 484-490
- URL: https://www.wjgnet.com/2218-5836/full/v8/i6/484.htm
- DOI: https://dx.doi.org/10.5312/wjo.v8.i6.484