Copyright
©2012 Baishideng Publishing Group Co.
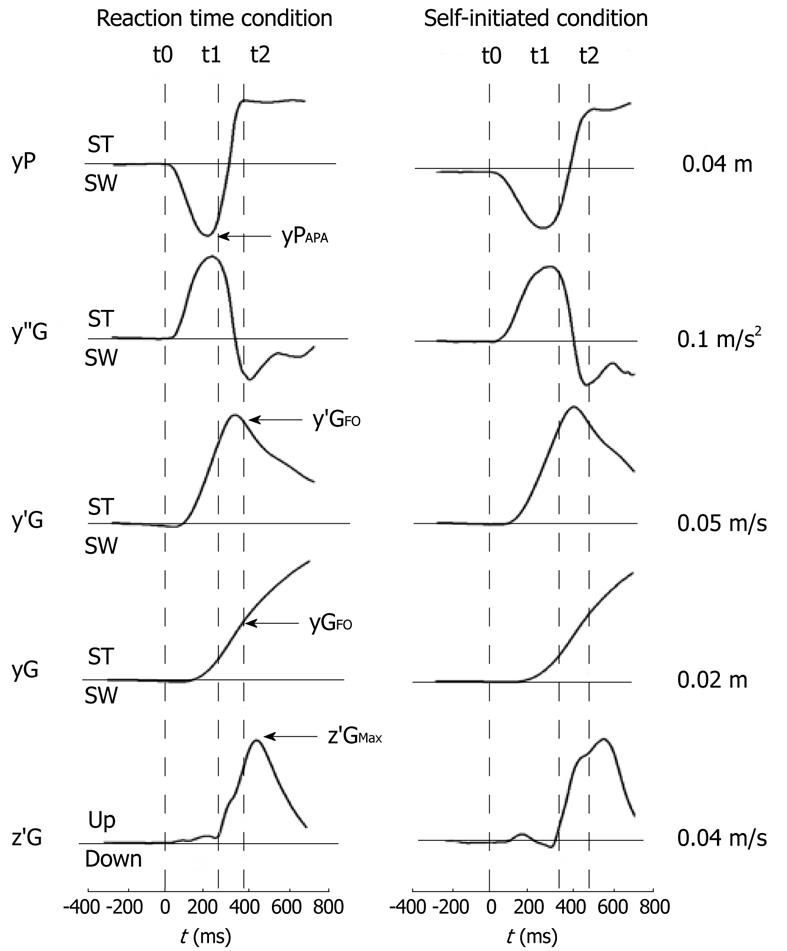
Figure 3 Example of the biomechanical traces of leg flexion in the reaction time and self-initiated conditions (one trial in one representative participant).
The figure presents the main experimental variables: yP, y’’G, y’G, yG, z’G, medio-lateral (ML) center of pressure (CoP) displacement, ML center of gravity (CoG) acceleration, ML CoG velocity, ML CoG displacement and vertical CoG velocity. The markers t0, t1, t2 represent respectively the onset variation of the y’’G trace from the baseline, swing heel off and swing foot off. SW and ST indicate the swing and stance leg side, respectively. Finally, yPAPA, y’GFO, yGFO, z’GMax are the peak of ML CoP displacement during APA, ML CoG velocity/displacement at the foot off time, peak of vertical CoG velocity (motor performance), respectively (from Yiou et al[52]).
- Citation: Yiou E, Caderby T, Hussein T. Adaptability of anticipatory postural adjustments associated with voluntary movement. World J Orthop 2012; 3(6): 75-86
- URL: https://www.wjgnet.com/2218-5836/full/v3/i6/75.htm
- DOI: https://dx.doi.org/10.5312/wjo.v3.i6.75


