Copyright
©2012 Baishideng Publishing Group Co.
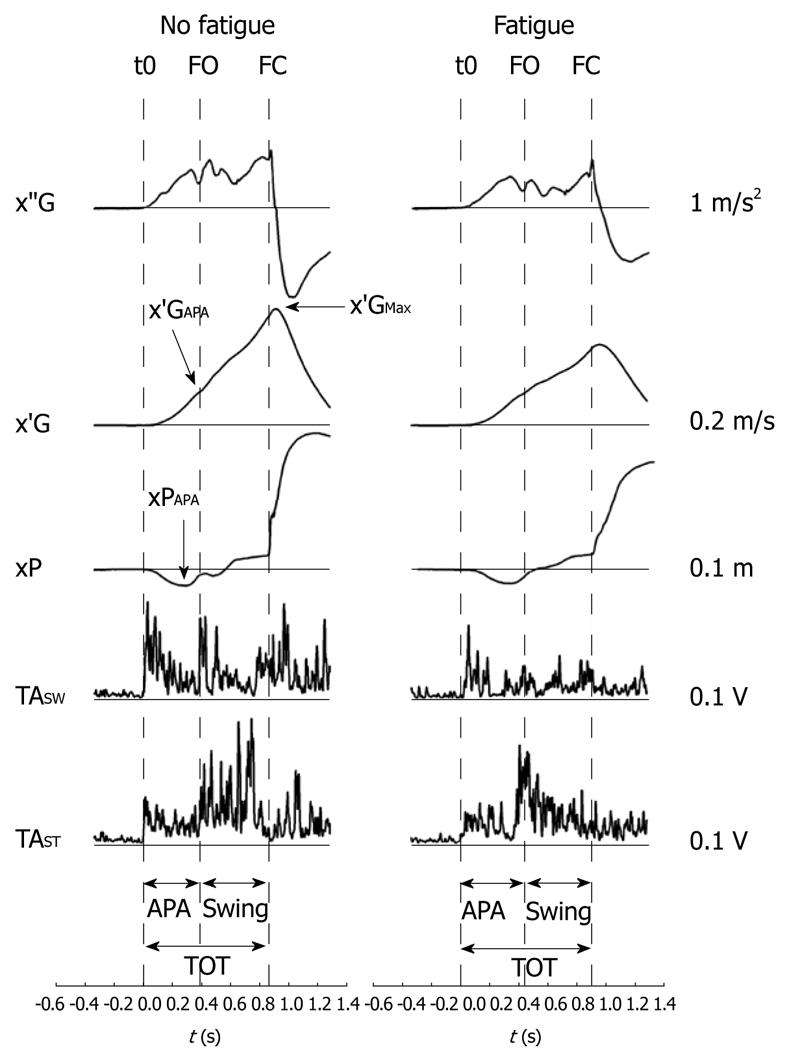
Figure 2 Example of biomechanical and electromyographical profiles of stepping initiation in the fatigue and no fatigue condition (one representative participant at spontaneous speed).
x”G, x’G, xP: Anteroposterior center of gravity acceleration, center of gravity velocity and center of pressure displacement, respectively; t0, FO, FC: Onset rise of x’’G trace, swing foot off, swing foot contact, respectively; TA: Rectified electrical activity of tibialis anterior; SW, ST: Swing and stance leg, respectively; APA, SW, TOT: Anticipatory postural adjustments, swing phase and total stepping initiation time windows, respectively; X’GMax, X’GAPA, xPAPA: Peak of center of gravity velocity, center of gravity velocity at foot off, peak of backward center of pressure displacement, respectively. Positive variation of the biomechanical traces indicates forward displacement, velocity or acceleration. Negative variation of these traces indicates backward displacement, velocity or acceleration (from Yiou et al[22]).
- Citation: Yiou E, Caderby T, Hussein T. Adaptability of anticipatory postural adjustments associated with voluntary movement. World J Orthop 2012; 3(6): 75-86
- URL: https://www.wjgnet.com/2218-5836/full/v3/i6/75.htm
- DOI: https://dx.doi.org/10.5312/wjo.v3.i6.75


