Copyright
©The Author(s) 2024.
World J Orthop. Mar 18, 2024; 15(3): 302-309
Published online Mar 18, 2024. doi: 10.5312/wjo.v15.i3.302
Published online Mar 18, 2024. doi: 10.5312/wjo.v15.i3.302
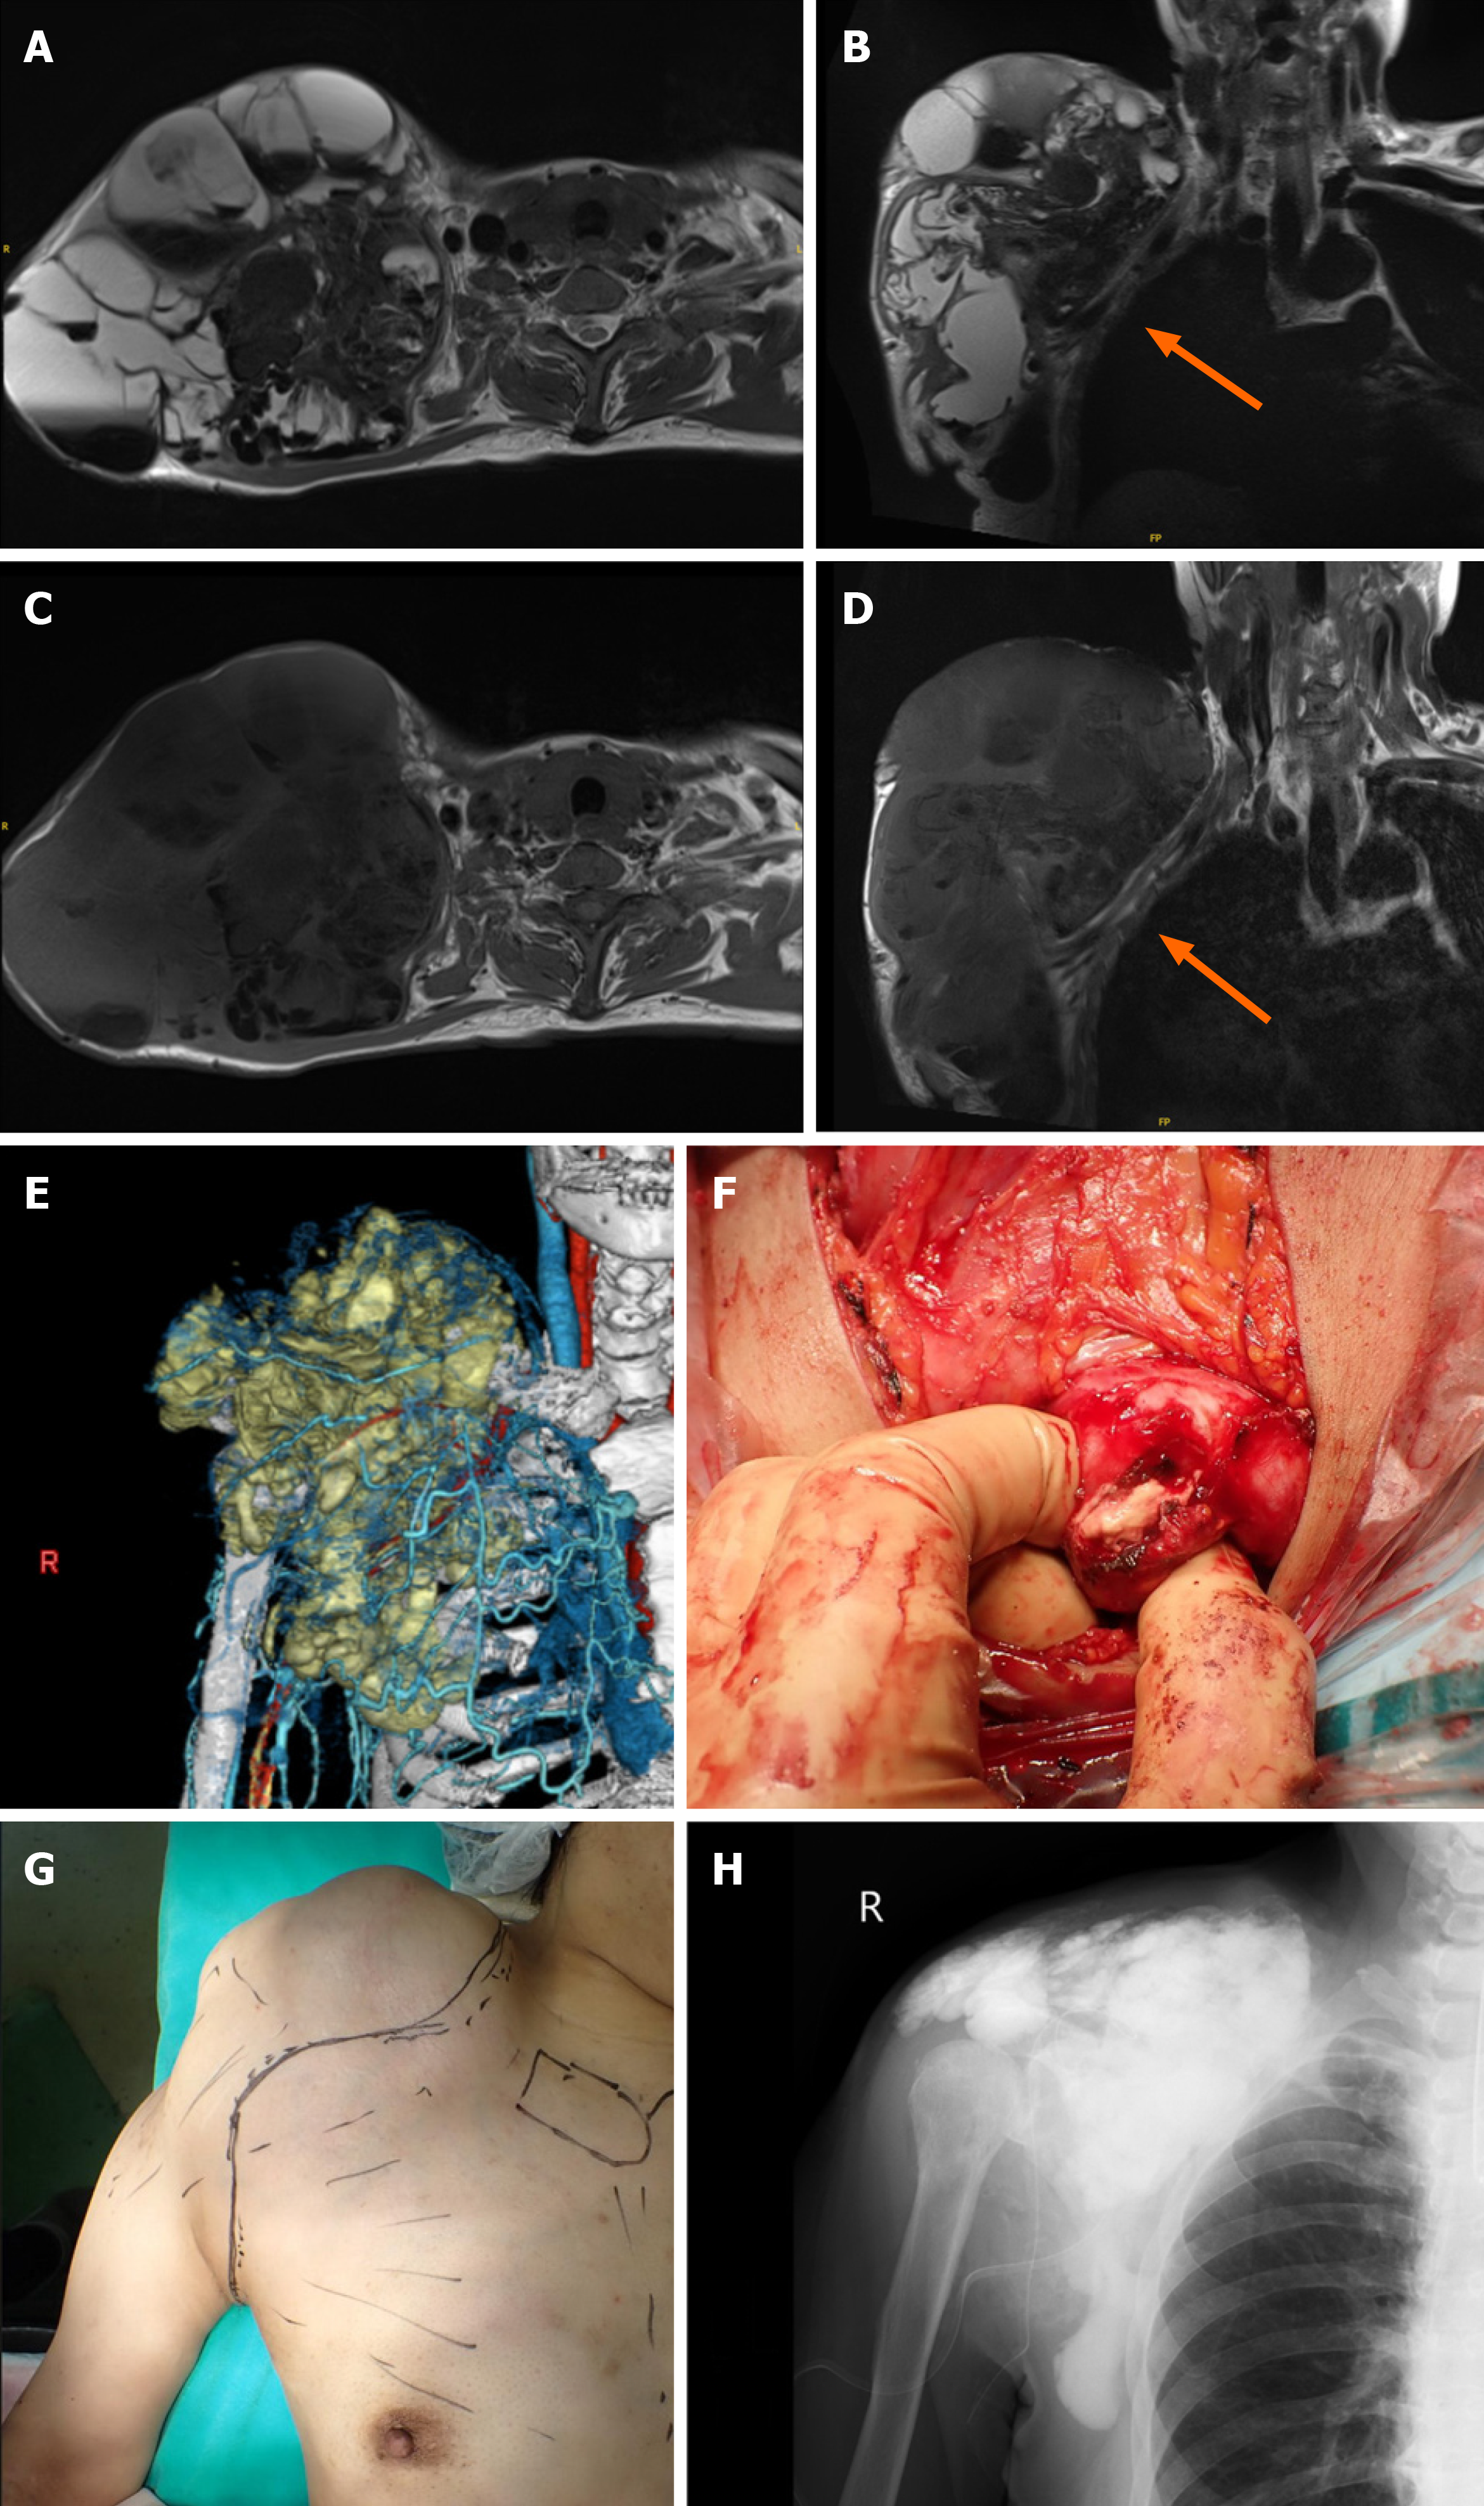
Figure 2 Magnetic resonance imaging and perioperative images.
A-D: The magnetic resonance (MR) images reveal multi-cystic lesions with low-to-high signal intensity on T2- (A and B) and T1-weighted images (C and D); A: Axial T2-weighted image shows a fluid-fluid level with a high signal at the top and a low signal at the bottom; B and D: Coronal MR images show brachial plexus and subclavian vessels between the lesion and the chest wall (orange arrows); E: Three-dimension computed tomography shows the extension of the calcified lesion; F: The operation field shows solid calcified lesion trapped in the fibrous wall; G: A photograph shows swelling and planned incision line; H: After the resection, the plain radiograph shows residual calcified fluid and the materials over the operative field.
- Citation: Noguchi T, Sakamoto A, Kakehi K, Matsuda S. New method of local adjuvant therapy with bicarbonate Ringer’s solution for tumoral calcinosis: A case report. World J Orthop 2024; 15(3): 302-309
- URL: https://www.wjgnet.com/2218-5836/full/v15/i3/302.htm
- DOI: https://dx.doi.org/10.5312/wjo.v15.i3.302


