Copyright
©The Author(s) 2015.
World J Orthop. Sep 18, 2015; 6(8): 577-589
Published online Sep 18, 2015. doi: 10.5312/wjo.v6.i8.577
Published online Sep 18, 2015. doi: 10.5312/wjo.v6.i8.577
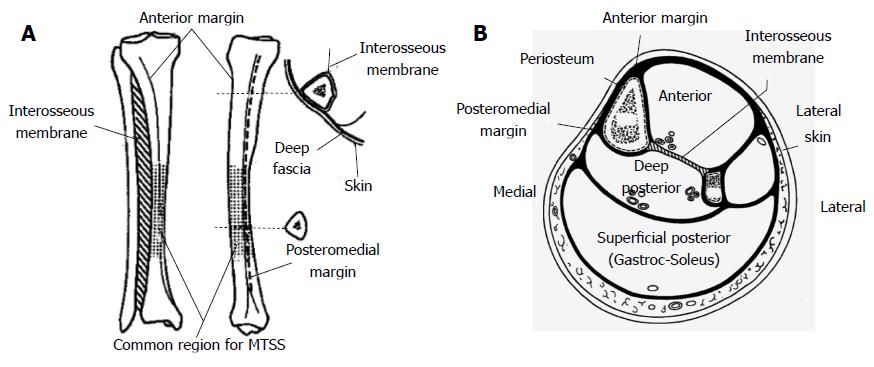
Figure 1 Anterior and medial views of the tibia with the main features shown, with the larger insert demonstrating the deep fascial attachments (A) and schematic section through the tibia illustrating the four compartments of the leg and their fascial coverings (B).
The wide subcutaneous medial surface of the tibia can be seen. Images adapted from Oakes[24].
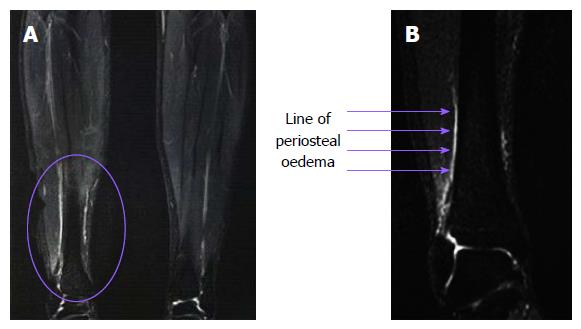
Figure 2 Coronal T2-weighted magnetic resonance imaging images of a 17-year-old female hockey player who was training on a concrete pitch covered with Astro Turf® for approximately 2 mo and was subsequently diagnosed with medial tibial stress syndrome.
A white longitudinal line of periosteal oedema on the medial cortex can clearly be seen on the enlarged view (right), which was consistent with the region of pain and tenderness.
Figure 3 Comparison of computed tomography with a new generation magnetic resonance imaging image.
(A) typical CT image (B) enlarged CT showing the high resolution cortical bone depiction and (C) MRI image for comparison. CT: Computed tomography; MRI: Magnetic resonance imaging.
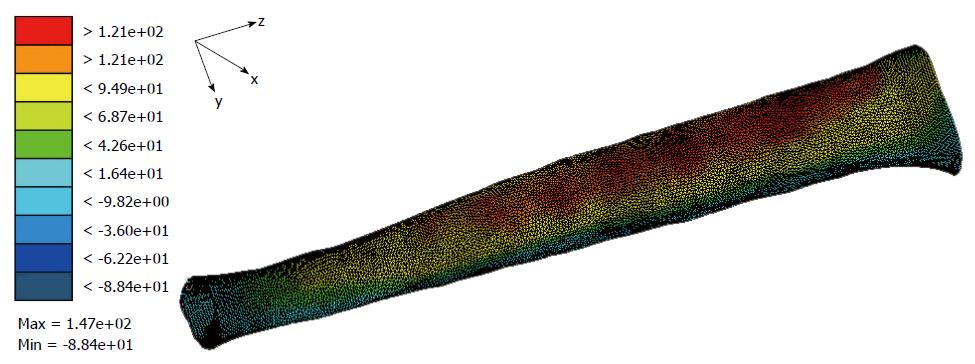
Figure 4 Preliminary finite element analysis by the current authors.
Maximum values of principal stresses in the model were significantly higher than those measured by strain gauge analysis, but similar to some other FE models in the literature. FE: Finite element.
- Citation: Franklyn M, Oakes B. Aetiology and mechanisms of injury in medial tibial stress syndrome: Current and future developments. World J Orthop 2015; 6(8): 577-589
- URL: https://www.wjgnet.com/2218-5836/full/v6/i8/577.htm
- DOI: https://dx.doi.org/10.5312/wjo.v6.i8.577


