Copyright
©The Author(s) 2025.
World J Gastrointest Pharmacol Ther. Jun 5, 2025; 16(2): 105335
Published online Jun 5, 2025. doi: 10.4292/wjgpt.v16.i2.105335
Published online Jun 5, 2025. doi: 10.4292/wjgpt.v16.i2.105335
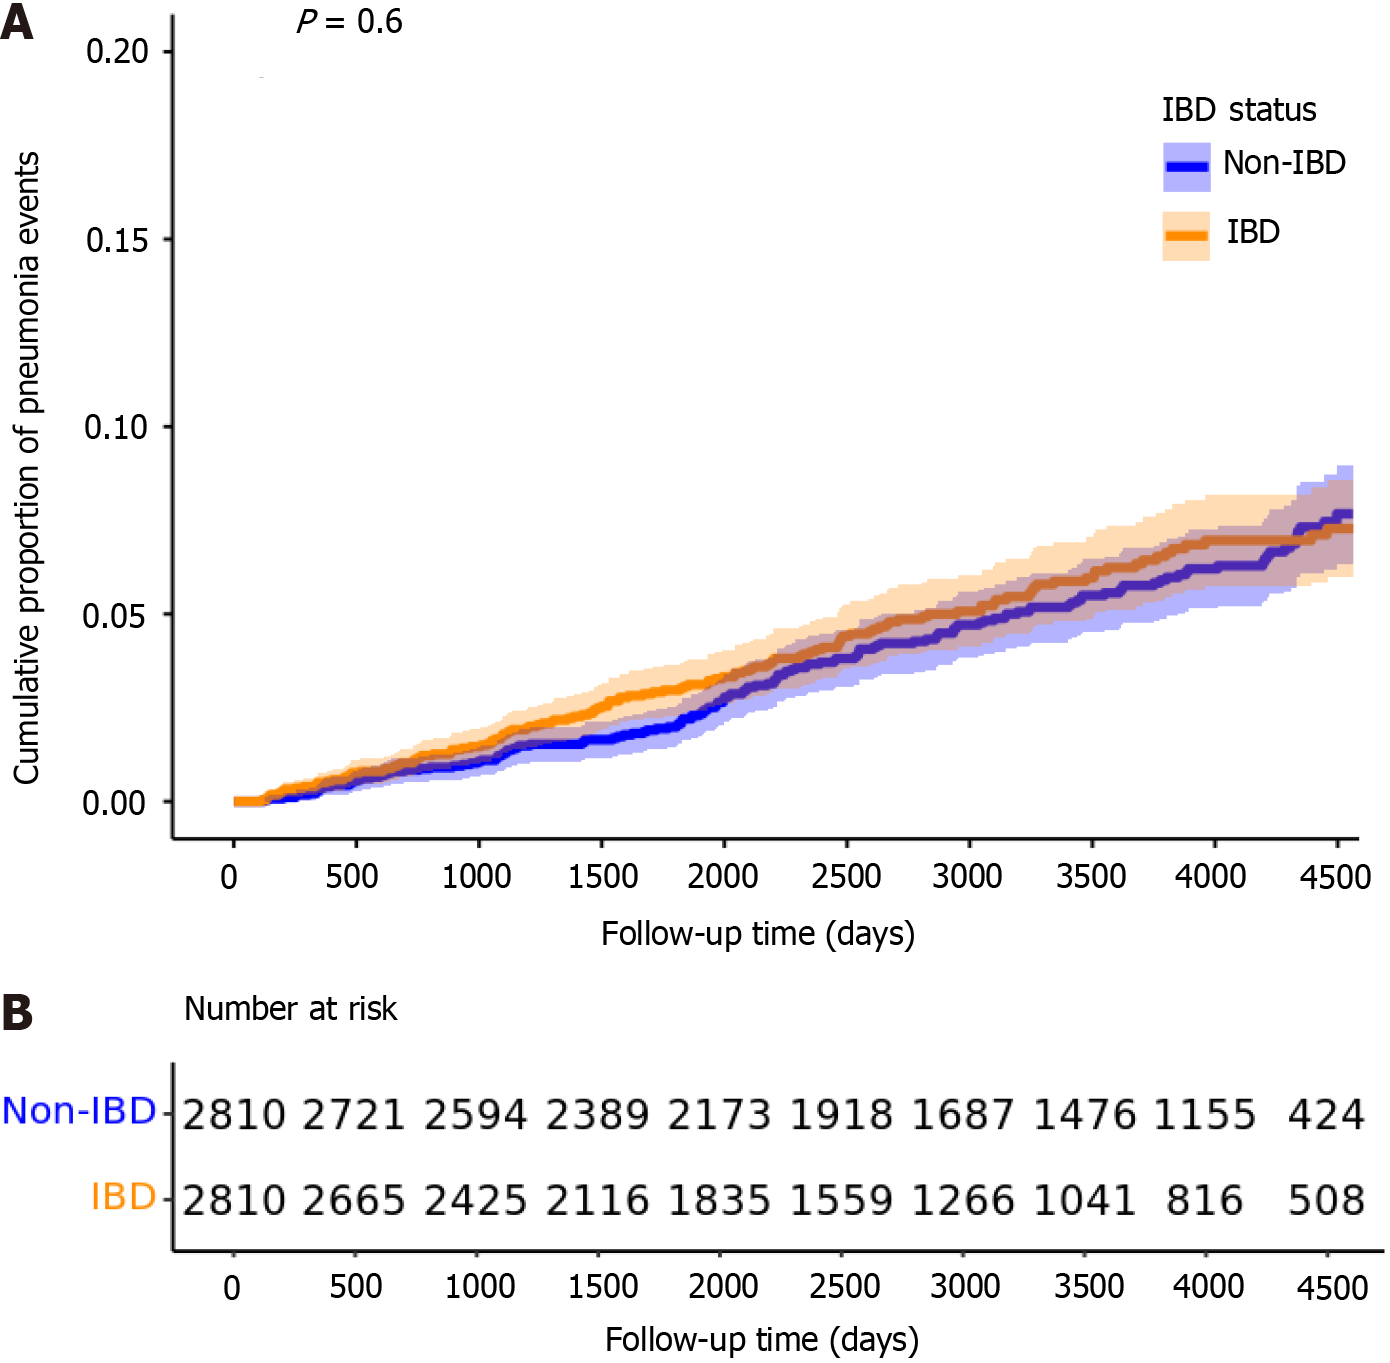
Figure 4 Kaplan-Meier curves showing the cumulative proportion of pneumonia events over time among participants with inflammatory bowel disease and non- inflammatory bowel disease in the base model.
A: Cumulative proportion of pneumonia events over follow-up time; B: Number at risk for each group. IBD: Inflammatory bowel disease.
- Citation: Eun Y, Culpepper-Morgan J, Akanmode AM, Thu MB, Sta Lucia AA, Thearle MS, Trousdale RK. Comorbidities and systemic steroids drive pneumonia risk in inflammatory bowel disease: Propensity score-matched cohort study. World J Gastrointest Pharmacol Ther 2025; 16(2): 105335
- URL: https://www.wjgnet.com/2150-5349/full/v16/i2/105335.htm
- DOI: https://dx.doi.org/10.4292/wjgpt.v16.i2.105335


