Copyright
©The Author(s) 2016.
World J Gastrointest Pathophysiol. May 15, 2016; 7(2): 223-234
Published online May 15, 2016. doi: 10.4291/wjgp.v7.i2.223
Published online May 15, 2016. doi: 10.4291/wjgp.v7.i2.223
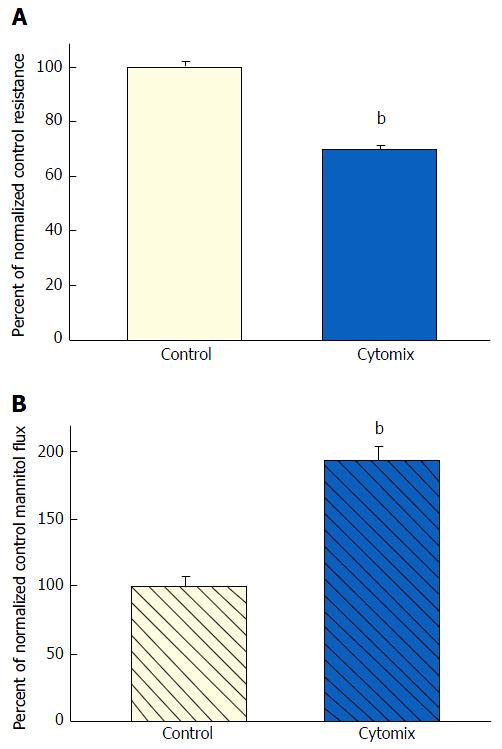
Figure 3 The effect of tumor necrosis factor-α + interferon-γ + interleukin-1β on CACO-2 transepithelial electrical resistance and transepithelial flux of 14C-D-mannitol.
A: Twenty-one day post-confluent CACO-2 cell layers cultured and treated as described in Figure 1, were refed in control medium or medium containing the combination of 200 ng/mL tumor necrosis factor-α, 150 ng/mL interferon-γ, and 50 ng/mL interleukin-1β. Data shown represent the mean ± SE of 16 cell layers per condition. Data represent the percent of control resistance normalized across 4 experiments; B: Radiotracer flux studies were conducted as described in Figure 1, with the same conditions listed above for panel A. Data represent the percent of control flux rate normalized across 2 experiments, and is expressed as the mean ± SE of 8 cell layers per condition. bP < 0.001 vs control (Student’s t test, one-tailed).
- Citation: DiGuilio KM, Mercogliano CM, Born J, Ferraro B, To J, Mixson B, Smith A, Valenzano MC, Mullin JM. Sieving characteristics of cytokine- and peroxide-induced epithelial barrier leak: Inhibition by berberine. World J Gastrointest Pathophysiol 2016; 7(2): 223-234
- URL: https://www.wjgnet.com/2150-5330/full/v7/i2/223.htm
- DOI: https://dx.doi.org/10.4291/wjgp.v7.i2.223


