Copyright
©The Author(s) 2016.
World J Gastrointest Pathophysiol. Feb 15, 2016; 7(1): 138-149
Published online Feb 15, 2016. doi: 10.4291/wjgp.v7.i1.138
Published online Feb 15, 2016. doi: 10.4291/wjgp.v7.i1.138
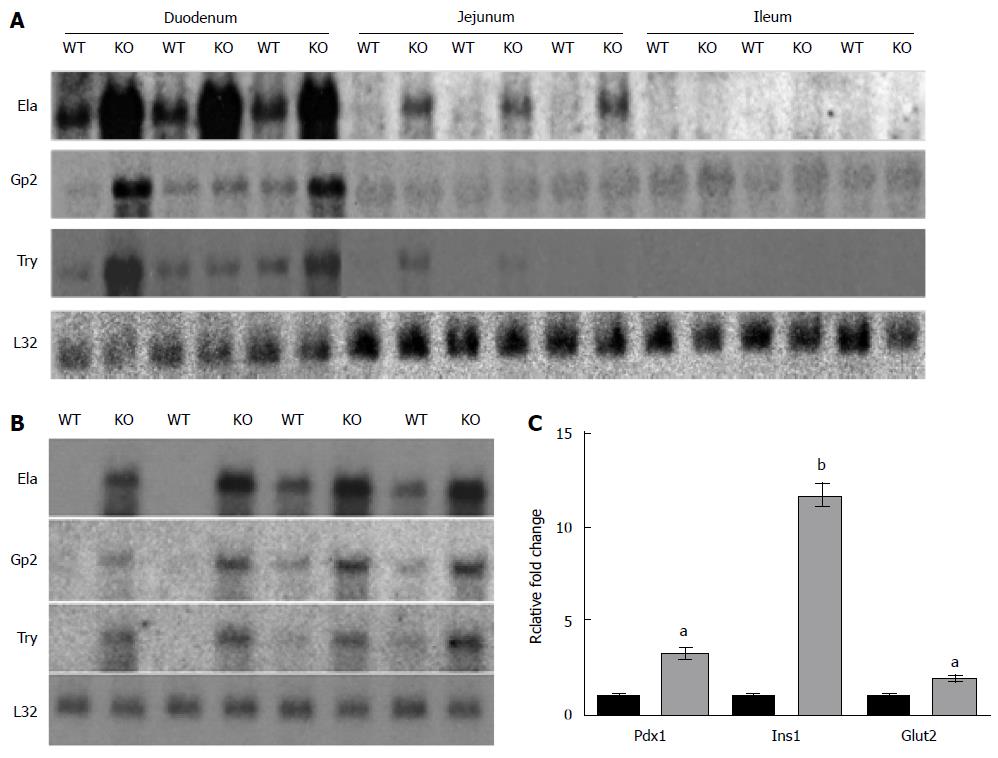
Figure 1 Northern blot and polymerase chain reaction analysis of duodenal gene expression.
A: Northern blots show upregulation of Ela, Gp2, and Try primarily in the duodenum of Nkcc1-/- (KO) mice relative to WT; n = 3 WT and 3 KO for each segment; B: Duodenal tissue from a separate cohort of mice confirms upregulation of elastase (4.7-fold, P = 0.002), glycoprotein 2 (3.5-fold, P = 0.02) and trypsin (6.0-fold, P = 0.002); n = 4 WT and 4 KO; C: Quantitative real-time polymerase chain reaction analysis of dx1, Ins1, and Glut2 shows increased expression of these genes in Nkcc1-/- duodenum. Expression levels were normalized using the L32 ribosomal subunit mRNA; n = 4 WT (black bars) and 4 KO (grey bars). aP < 0.01 vs WT, bP < 0.002 vs WT. Gp2: Glycoprotein 2; Ela: Elastase; Try: Trypsin; WT: Wild-type; KO: Nkcc1-/-; Pdx1: Pancreatic duodenal homeobox 1; Ins1: Insulin1; Glut2: Glucose transporter type 2.
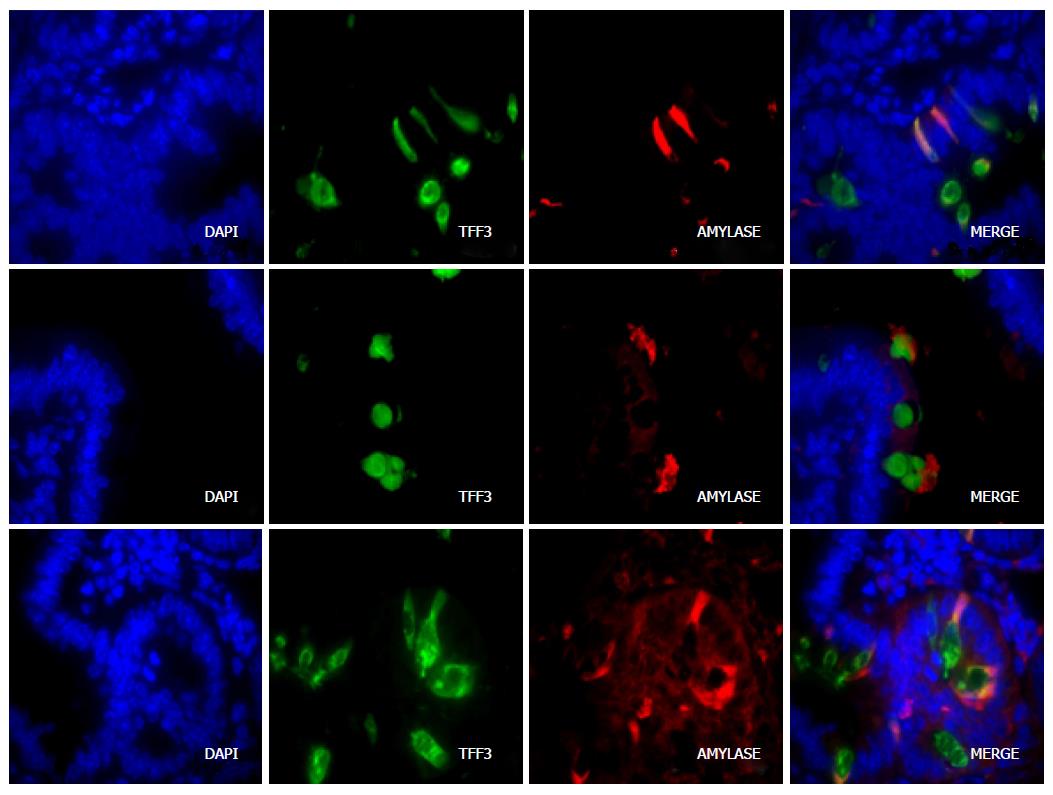
Figure 2 Colocalization of peptidases in goblet cells of the duodenum.
DAPI (blue) identifies nuclei and TFF3 (intestinal trefoil factor, green fluorescence) identifies goblet cells. Elastase, amylase and trypsin are identified by red fluorescence. The merged images show colocalization of each of these proteases and TFF3. Staining patterns were assessed in 4 wild-type and 3 Nkcc1-/- mice. The images shown are for NKCC1-null mice. Control sections with only primary or only secondary antibodies do not identify goblet cells (not shown).
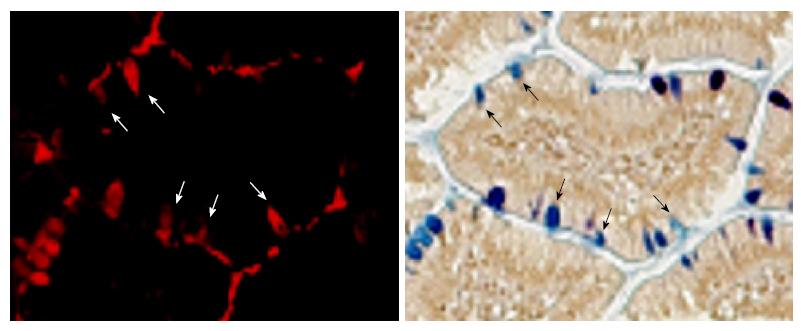
Figure 3 Amylase is expressed in a subset of goblet cells.
Immunofluorescence of amylase (top, red) identifies many, but not all, goblet cells that are clearly stained with AB/PAS (bottom). The same sections (slides) from NKCC1-null intestine was used for immunofluorescence, imaged, and then stained with AB/PAS. Arrows indicate the same cell in both images. AB/PAS: Alcian Blue/Periodic Acid-Schiff.
- Citation: Bradford EM, Vairamani K, Shull GE. Differential expression of pancreatic protein and chemosensing receptor mRNAs in NKCC1-null intestine. World J Gastrointest Pathophysiol 2016; 7(1): 138-149
- URL: https://www.wjgnet.com/2150-5330/full/v7/i1/138.htm
- DOI: https://dx.doi.org/10.4291/wjgp.v7.i1.138


