Copyright
©The Author(s) 2017.
World J Radiol. Sep 28, 2017; 9(9): 365-370
Published online Sep 28, 2017. doi: 10.4329/wjr.v9.i9.365
Published online Sep 28, 2017. doi: 10.4329/wjr.v9.i9.365
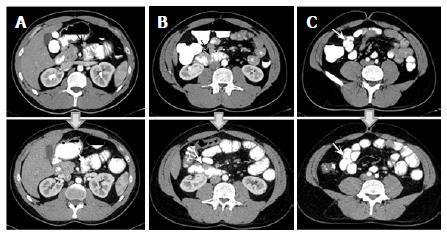
Figure 5 Imatinib response evaluation of the gastrointestinal stromal tumors using contrast-enhanced abdominal computerized tomography.
Pre- and post-treatment CT images are shown on upper and lower series respectively. A partial response is seen in jejunal (A, B) and ileal (C) GISTs in the following 3 mo after imatinib therapy (arrows). CT: Computerized tomography; GIST: Gastrointestinal stromal tumors.
- Citation: Engin G, Eraslan S, Kayserili H, Kapran Y, Akman H, Akyuz A, Aykan NF. Imatinib response of gastrointestinal stromal tumor patients with germline mutation on KIT exon 13: A family report. World J Radiol 2017; 9(9): 365-370
- URL: https://www.wjgnet.com/1949-8470/full/v9/i9/365.htm
- DOI: https://dx.doi.org/10.4329/wjr.v9.i9.365


