Copyright
©The Author(s) 2016.
World J Radiol. Feb 28, 2016; 8(2): 148-158
Published online Feb 28, 2016. doi: 10.4329/wjr.v8.i2.148
Published online Feb 28, 2016. doi: 10.4329/wjr.v8.i2.148
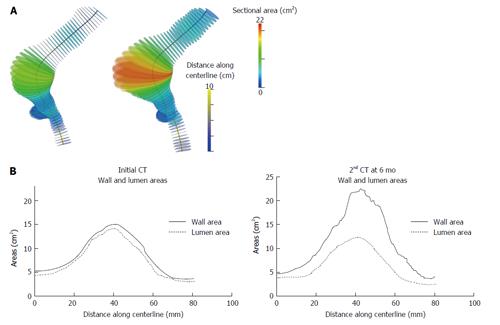
Figure 4 Cross-sections perpendicular to the centerline with regard to sectional areas for initial and follow-up abdominal aortic aneurysm-models.
Maximum sectional areas present values of 22.5 cm2 and 15 cm2 respectively. Color scale on the centerlines depicts distance along the centerline with 8 cm representing aortic bifurcation. Sections areas are displayed against distance along the centerline indicating that maximum values are obtained in the same distance from aortic bifurcation (approximately 4 cm). Figure originally published at Kontopodis et al[50].
- Citation: Kontopodis N, Lioudaki S, Pantidis D, Papadopoulos G, Georgakarakos E, Ioannou CV. Advances in determining abdominal aortic aneurysm size and growth. World J Radiol 2016; 8(2): 148-158
- URL: https://www.wjgnet.com/1949-8470/full/v8/i2/148.htm
- DOI: https://dx.doi.org/10.4329/wjr.v8.i2.148


