Copyright
©The Author(s) 2015.
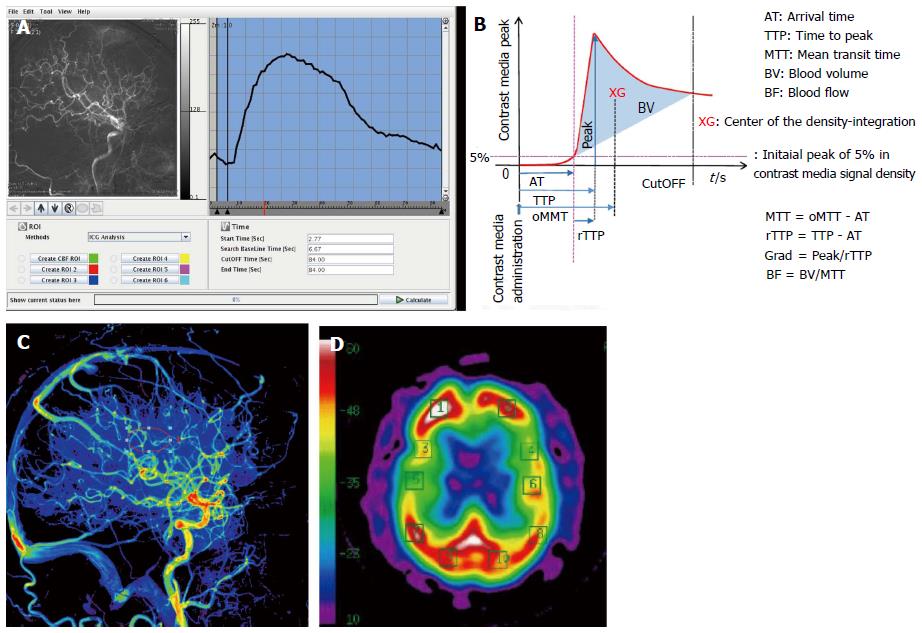
Figure 1 Digital subtraction angiography.
A: Time-density curve of digital subtraction angiography lateral view. The change in the concentration of the contrast media, visualized as a change in brightness, was calculated; B: The parameters calculable by the “Flow-Insight” application; C: Lateral view of a pre-operative qualitative image of cerebral blood flow in Case 2; D: Pre-operative N-isopropyl-p-[123I] iodoamphetamine-single-photon emission computed tomography image.
- Citation: Wada H, Saito M, Kamada K. Evaluation of changes of intracranial blood flow after carotid artery stenting using digital subtraction angiography flow assessment. World J Radiol 2015; 7(2): 45-51
- URL: https://www.wjgnet.com/1949-8470/full/v7/i2/45.htm
- DOI: https://dx.doi.org/10.4329/wjr.v7.i2.45


