Copyright
©2014 Baishideng Publishing Group Inc.
World J Radiol. Dec 28, 2014; 6(12): 895-906
Published online Dec 28, 2014. doi: 10.4329/wjr.v6.i12.895
Published online Dec 28, 2014. doi: 10.4329/wjr.v6.i12.895
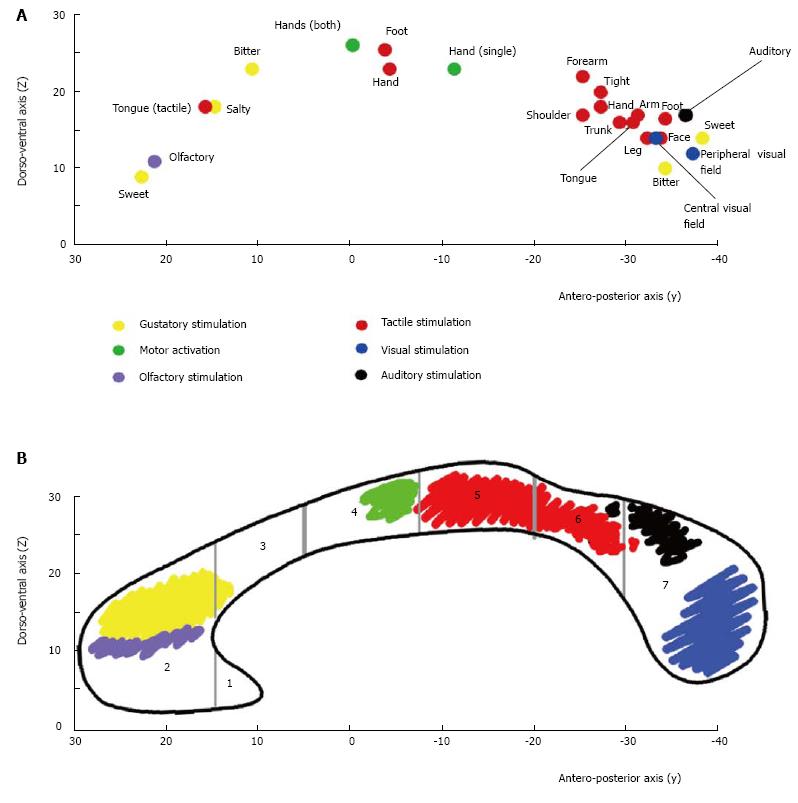
Figure 3 Callosal activation and callosal fibers topography.
A: Summary diagram showing the distribution of the callosal foci evoked by different stimuli in control subjects. Each dot represents the “mean” value of the y and z Talairach coordinates (reported on the respective Cartesian axes) of the foci evoked by different stimuli. Yellow: Foci by gustatory stimuli; violet: Olfactory stimuli; green: Hand motor tasks; red: Tactile stimuli; black: Auditory stimuli; blue: Visual stimuli. See the text for a detailed description; B: Shows the crossing sites of interhemispheric fibers interconnecting the sensory and motor cortical areas activated by the specific peripheral stimuli. Vertical gray lines mark the seven CC regions according to Witelson[8].
- Citation: Fabri M, Pierpaoli C, Barbaresi P, Polonara G. Functional topography of the corpus callosum investigated by DTI and fMRI. World J Radiol 2014; 6(12): 895-906
- URL: https://www.wjgnet.com/1949-8470/full/v6/i12/895.htm
- DOI: https://dx.doi.org/10.4329/wjr.v6.i12.895


