Copyright
©2014 Baishideng Publishing Group Inc.
World J Radiol. Nov 28, 2014; 6(11): 855-864
Published online Nov 28, 2014. doi: 10.4329/wjr.v6.i11.855
Published online Nov 28, 2014. doi: 10.4329/wjr.v6.i11.855
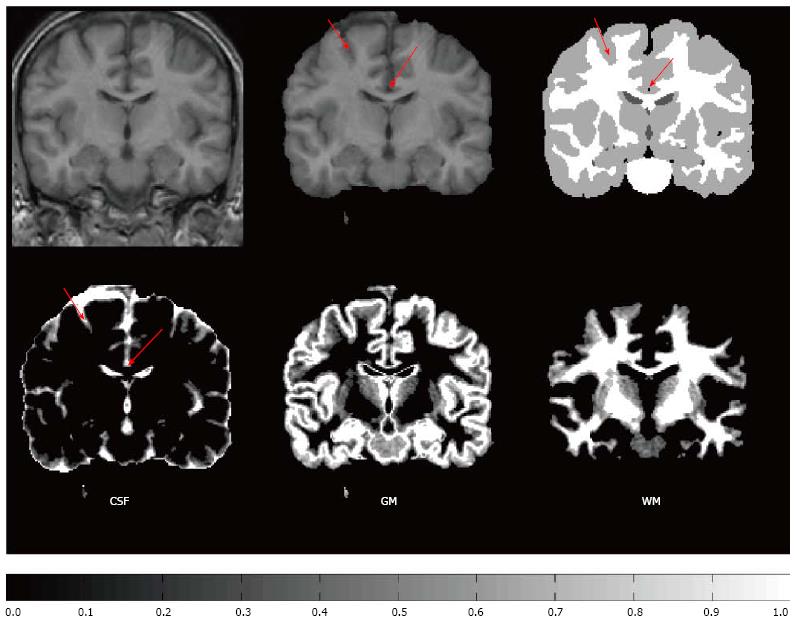
Figure 2 Example of partial volume estimation.
Top row, from left: A coronal section of T1 weighted MR image; A skull stripped version of the coronal section; A manual labeling into gray matter (GM) (gray color), white matter (WM) (white color), and cerebro-spinal fluid (CSF) (dark gray color). Bottom row: Estimates of partial volume coefficients (PVCs) for CSF, GM, and WM. The color bar refers to the PVC estimates in the bottom row. The image is obtained from the IBSR2 dataset provided by the Center for Morphometric Analysis at Massachusetts General Hospital and PVCs were computed as described in the ref. [28]. Note how the manual hard labeling completely misses the CSF in the interhemispheric fissure as well as in the superior frontal sulcus pointed by red arrows. Instead PVC estimates of CSF in the bottom row capture well the sulcal CSF.
- Citation: Tohka J. Partial volume effect modeling for segmentation and tissue classification of brain magnetic resonance images: A review. World J Radiol 2014; 6(11): 855-864
- URL: https://www.wjgnet.com/1949-8470/full/v6/i11/855.htm
- DOI: https://dx.doi.org/10.4329/wjr.v6.i11.855


