Copyright
©2013 Baishideng Publishing Group Co.
World J Radiol. Dec 28, 2013; 5(12): 498-502
Published online Dec 28, 2013. doi: 10.4329/wjr.v5.i12.498
Published online Dec 28, 2013. doi: 10.4329/wjr.v5.i12.498
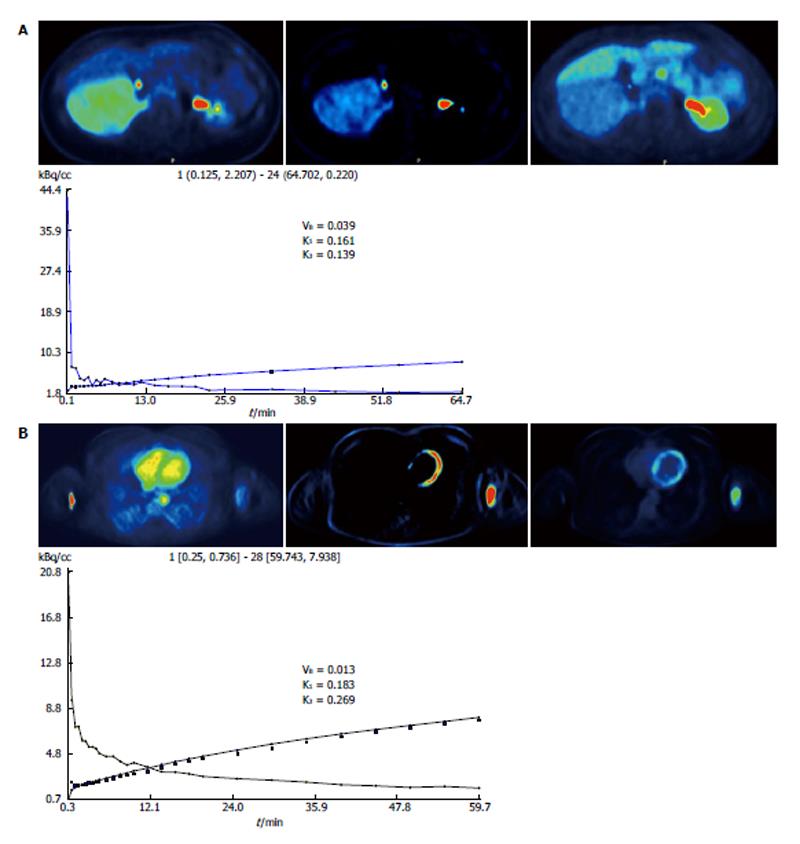
Figure 2 18F-fluorodeoxyglucose positron emission tomography study.
A: 18F-fluorodeoxyglucose (18F-FDG) positron emission tomography (PET) study of the retroperitoneal tumor; B: 18F-FDG PET study of the left upper arm tumor. Left row, FDG images (55-60 min after tracer injection) demonstrating an enhanced uptake in the left upper arm. Middle row, parametric images of the slope demonstrating an intense signal in the tumor area. Right row parametric images of the intercept demonstrating also an enhancement within the tumor area. The coordinate figure, corresponding time-activity curve of the 18F-FDG kinetics after application of a two-tissue compartment model.
- Citation: Sachpekidis C, Roumia S, Schwarzbach M, Dimitrakopoulou-Strauss A. Dynamic 18F-fluorodeoxyglucose positron emission tomography/CT in hibernoma: Enhanced tracer uptake mimicking liposarcoma. World J Radiol 2013; 5(12): 498-502
- URL: https://www.wjgnet.com/1949-8470/full/v5/i12/498.htm
- DOI: https://dx.doi.org/10.4329/wjr.v5.i12.498


