Copyright
©2011 Baishideng Publishing Group Co.
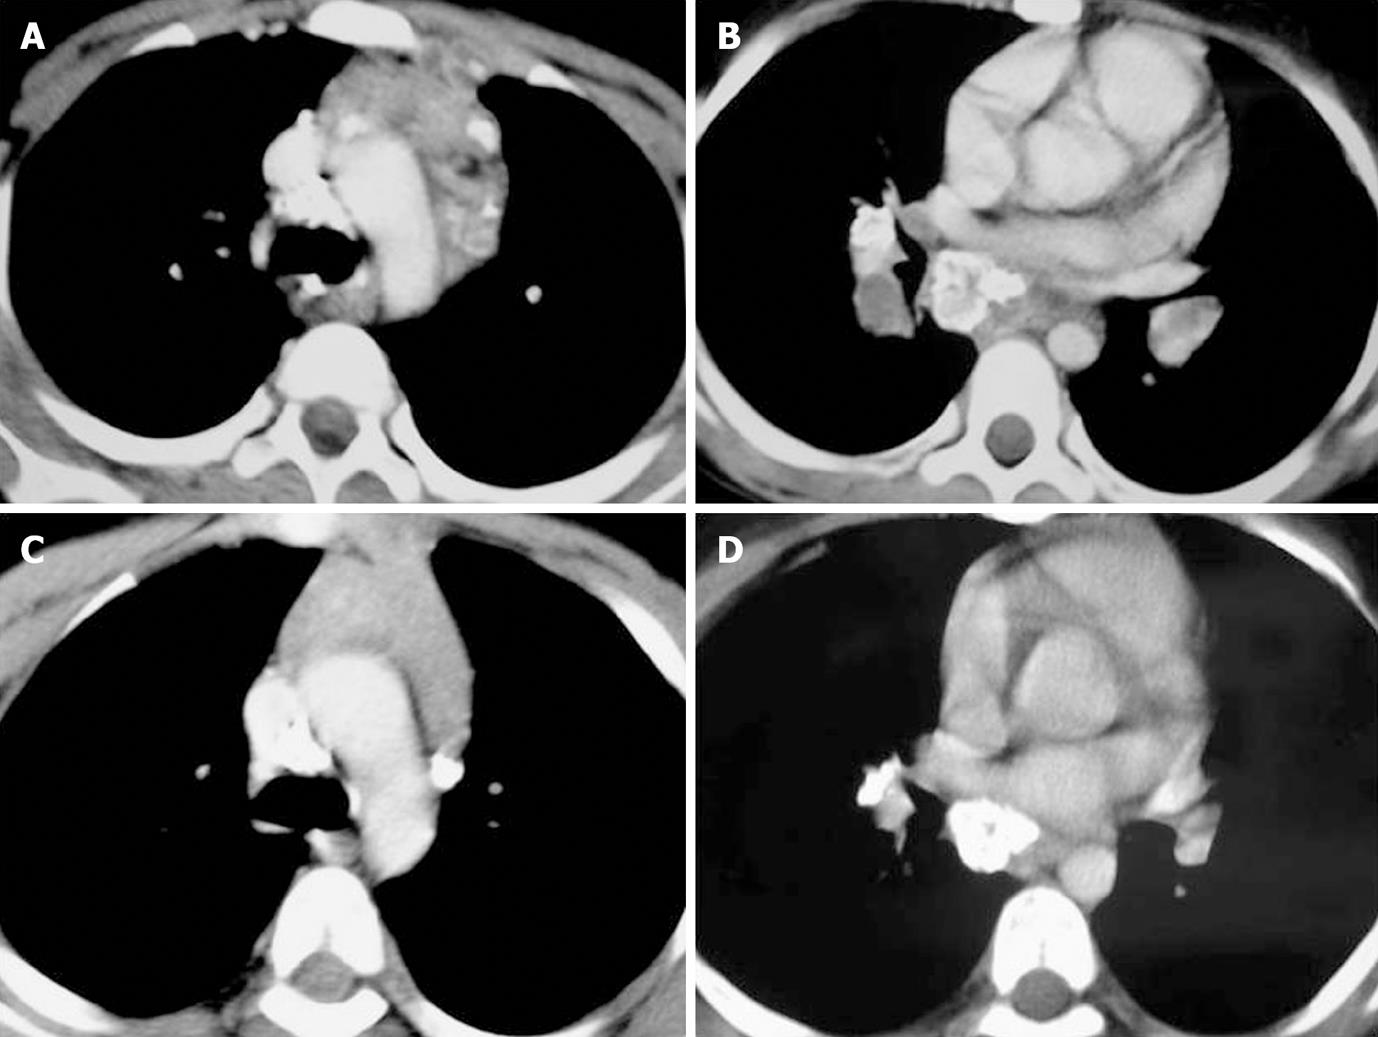
Figure 4 Pretreatment computed tomography (A, B) showing calcified precarinal, prevascular, right hilar, and azygoesophageal nodes, with necrotic areas and follow up computed tomography after anti-tubercular treatment (C, D) showing resolution of necrotic areas, with residual calcification.
- Citation: Mukund A, Khurana R, Bhalla AS, Gupta AK, Kabra SK. CT patterns of nodal disease in pediatric chest tuberculosis. World J Radiol 2011; 3(1): 17-23
- URL: https://www.wjgnet.com/1949-8470/full/v3/i1/17.htm
- DOI: https://dx.doi.org/10.4329/wjr.v3.i1.17


