Copyright
©The Author(s) 2025.
World J Radiol. Aug 28, 2025; 17(8): 110307
Published online Aug 28, 2025. doi: 10.4329/wjr.v17.i8.110307
Published online Aug 28, 2025. doi: 10.4329/wjr.v17.i8.110307
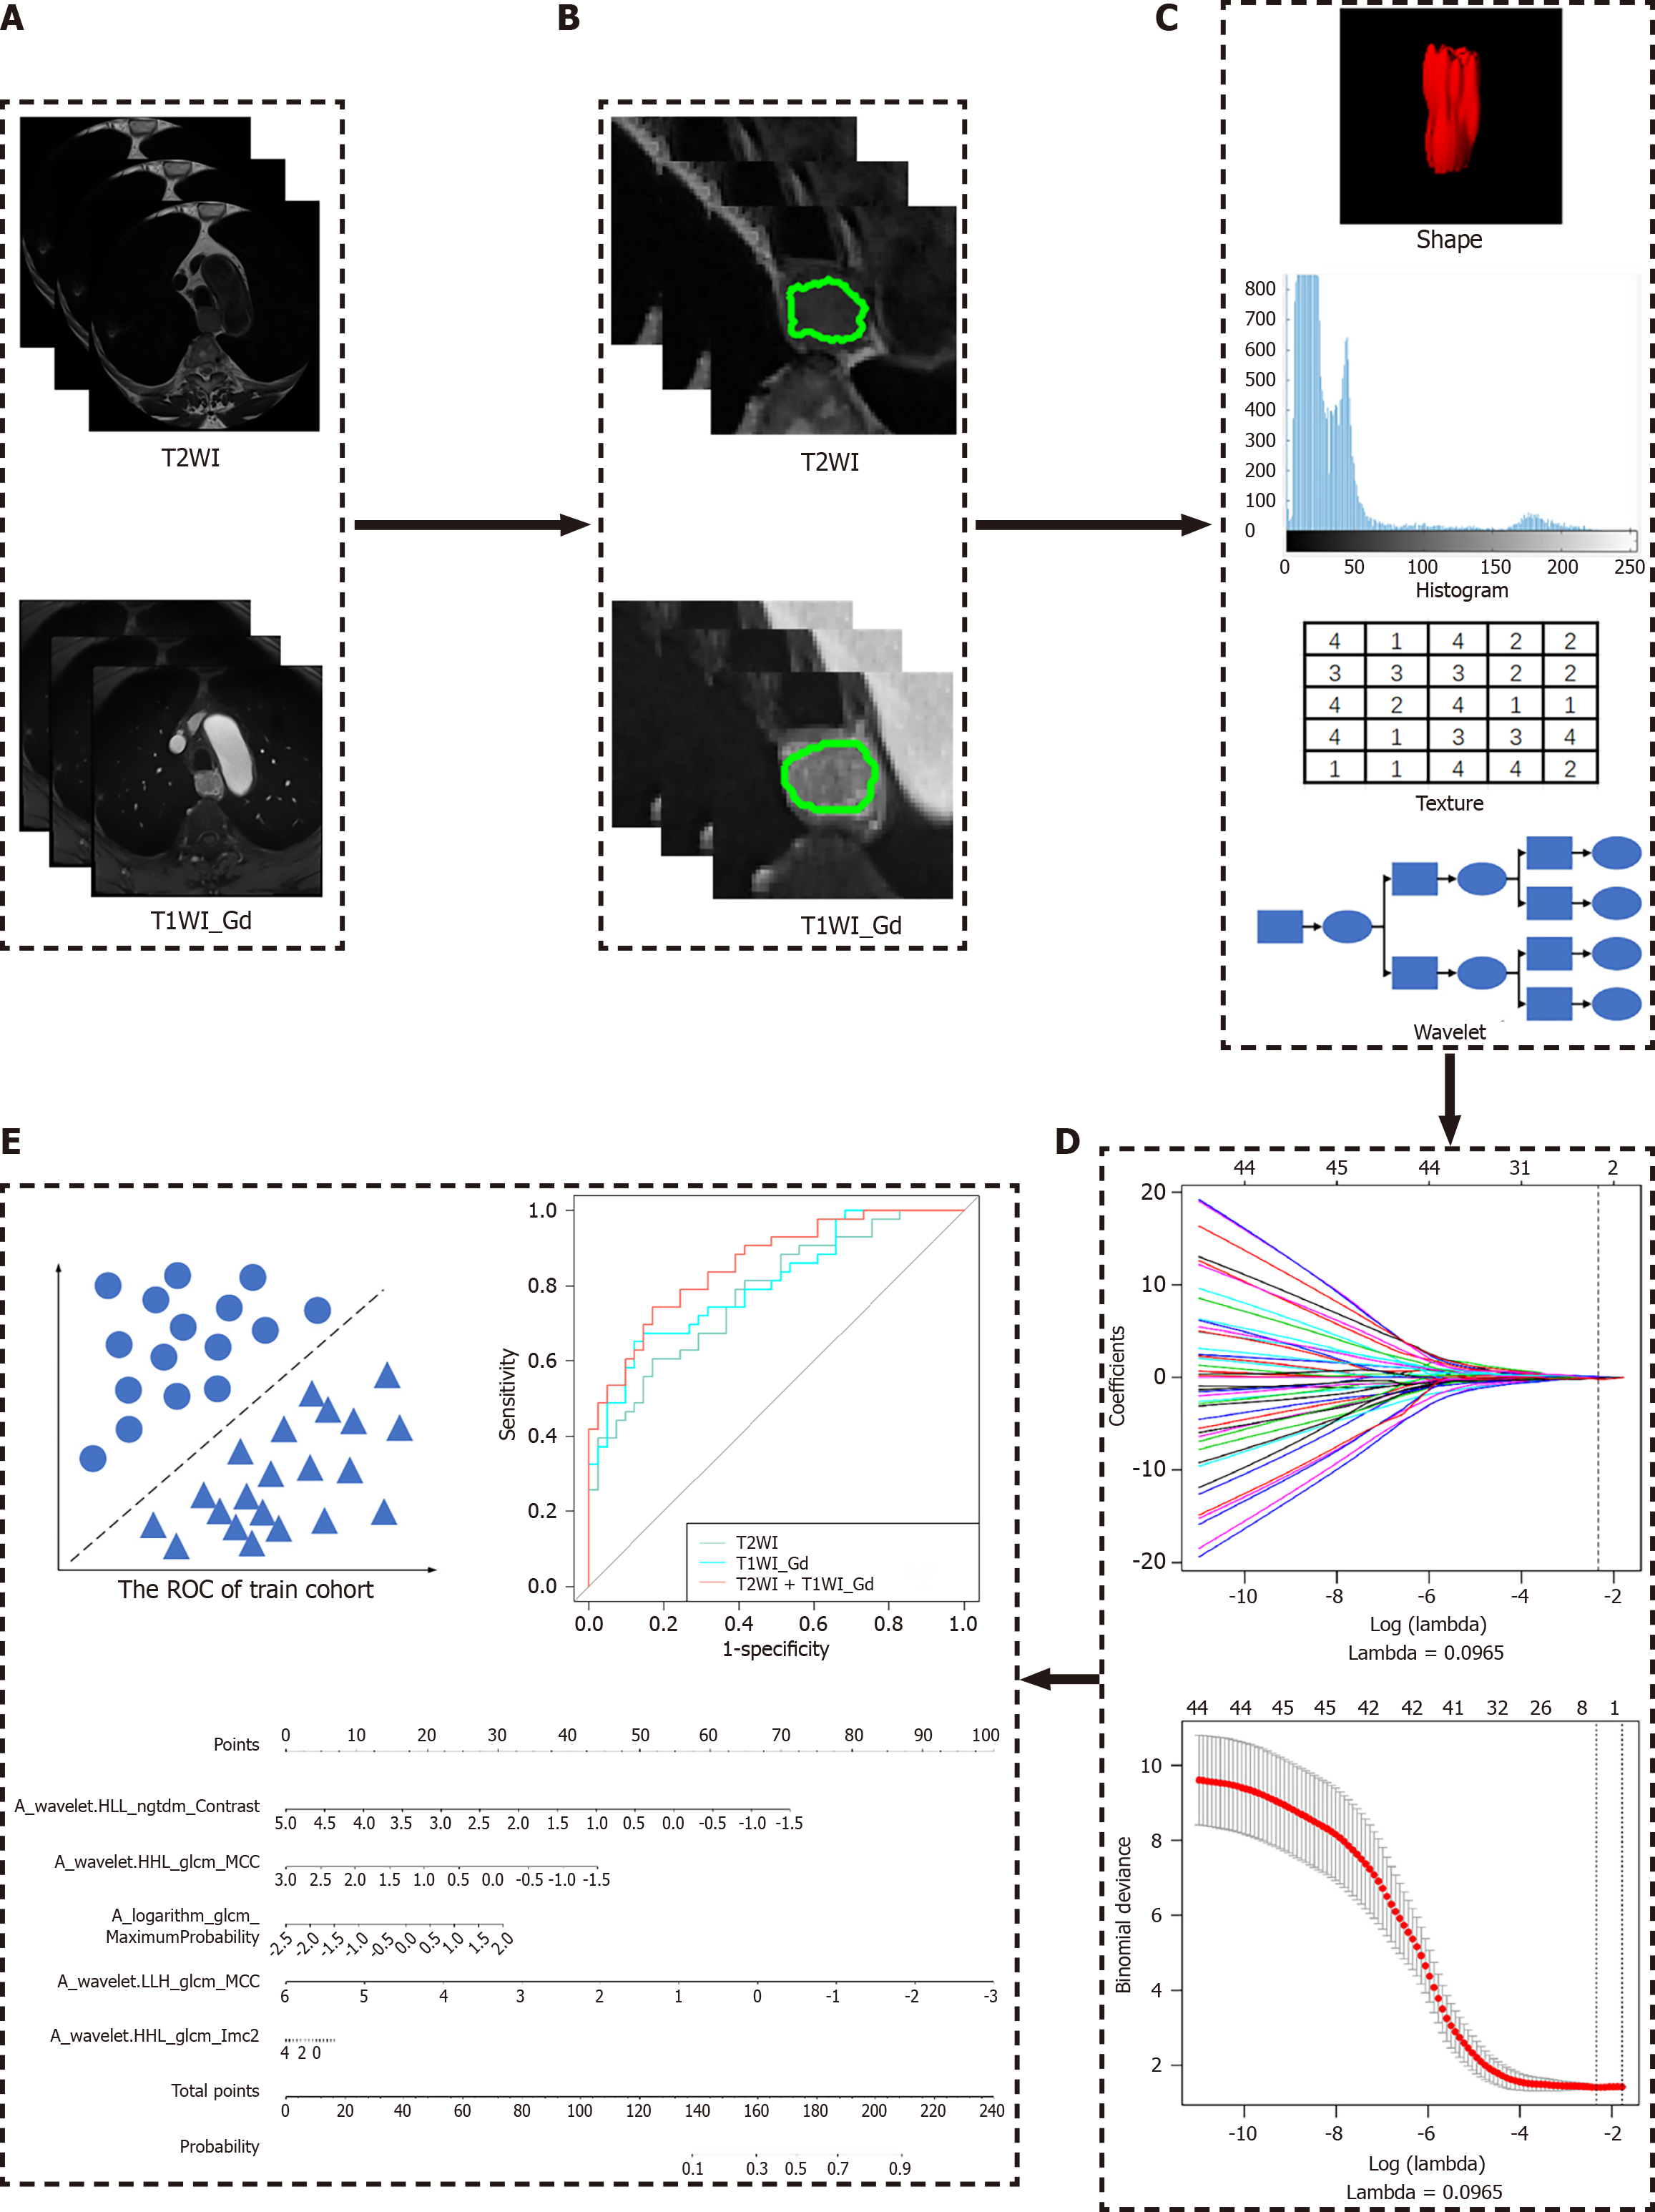
Figure 1 Flowchart of the study.
A: Original magnetic resonance imaging images, including T2-weighted imaging (T2WI) and T1-weighted imaging (T1WI)-Gd; B: Segmentation of both T2WI and T1WI-Gd images delineated the tumor region; C: Radiomic features were extracted from the tumor region, including shape, first-order histogram, texture and wavelet group analysis; D: A series of features were selected to build the radiomics signature using the minimal redundancy maximal relevance and the least absolute shrinkage and selection operator method; E: The classification performance of the radiomic signature was evaluated using the receiver operating characteristic curves in both the primary and validation cohort. ROC: Receiver operating characteristic; T1WI: T1-weighted imaging; T2WI: T2-weighted imaging.
- Citation: Yang RH, Lin ZP, Dong T, Fan WX, Qin HD, Jiang GH, Dai HY. Magnetic resonance imaging-based radiomics signature for predicting preoperative staging of esophageal cancer. World J Radiol 2025; 17(8): 110307
- URL: https://www.wjgnet.com/1949-8470/full/v17/i8/110307.htm
- DOI: https://dx.doi.org/10.4329/wjr.v17.i8.110307


