Copyright
©The Author(s) 2025.
World J Radiol. Jun 28, 2025; 17(6): 105728
Published online Jun 28, 2025. doi: 10.4329/wjr.v17.i6.105728
Published online Jun 28, 2025. doi: 10.4329/wjr.v17.i6.105728
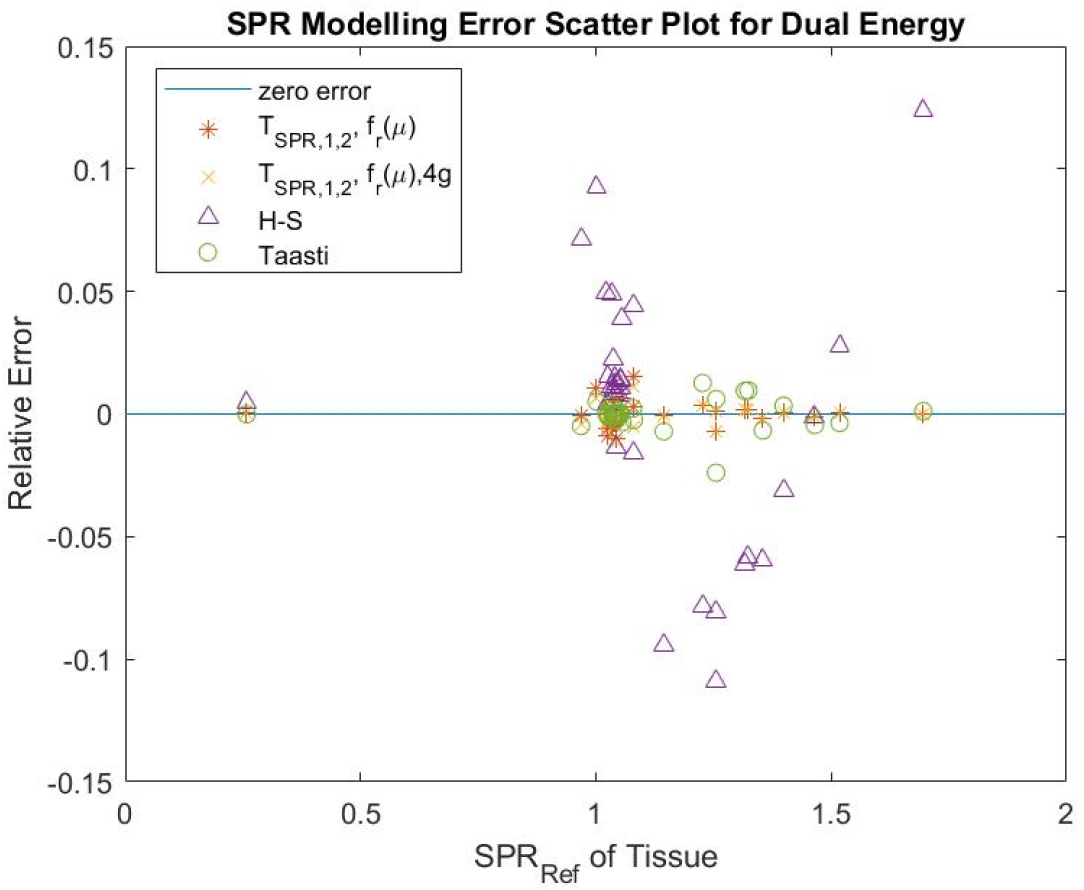
Figure 3 Individual tissues stopping power ratio relative error for the presented dual energy methods as presented in Chika[21].
The relative stopping power ratio estimating error for each tissue is plotted against the reference (actual) stopping power ratio on the graph. This is plotted for different methods as shown in figure legend where fr (μ)= μL/μH. Citation: Chika CE. Machine Learning Approach and Model for Predicting Proton Stopping Power Ratio and Other Parameters Using Computed Tomography Images. J Med Phys 2024; 49: 519-530. Copyright© The Authors 2024. Published by Wolters Kluwer Medknow Publications. This article is available under the terms of the Creative Commons Attribution-NonCommercial-ShareAlike License (CC BY-NC-SA), which permits non-commercial use, distribution and reproduction in any medium, provided the original work is properly cited. Permission only needs to be obtained for commercial use. SPR: Stopping power ratio.
- Citation: Chika CE. Advances in dual energy computed tomography approach for proton stopping power ratio computation in radiotherapy. World J Radiol 2025; 17(6): 105728
- URL: https://www.wjgnet.com/1949-8470/full/v17/i6/105728.htm
- DOI: https://dx.doi.org/10.4329/wjr.v17.i6.105728


