Copyright
©The Author(s) 2025.
World J Radiol. Jun 28, 2025; 17(6): 105728
Published online Jun 28, 2025. doi: 10.4329/wjr.v17.i6.105728
Published online Jun 28, 2025. doi: 10.4329/wjr.v17.i6.105728
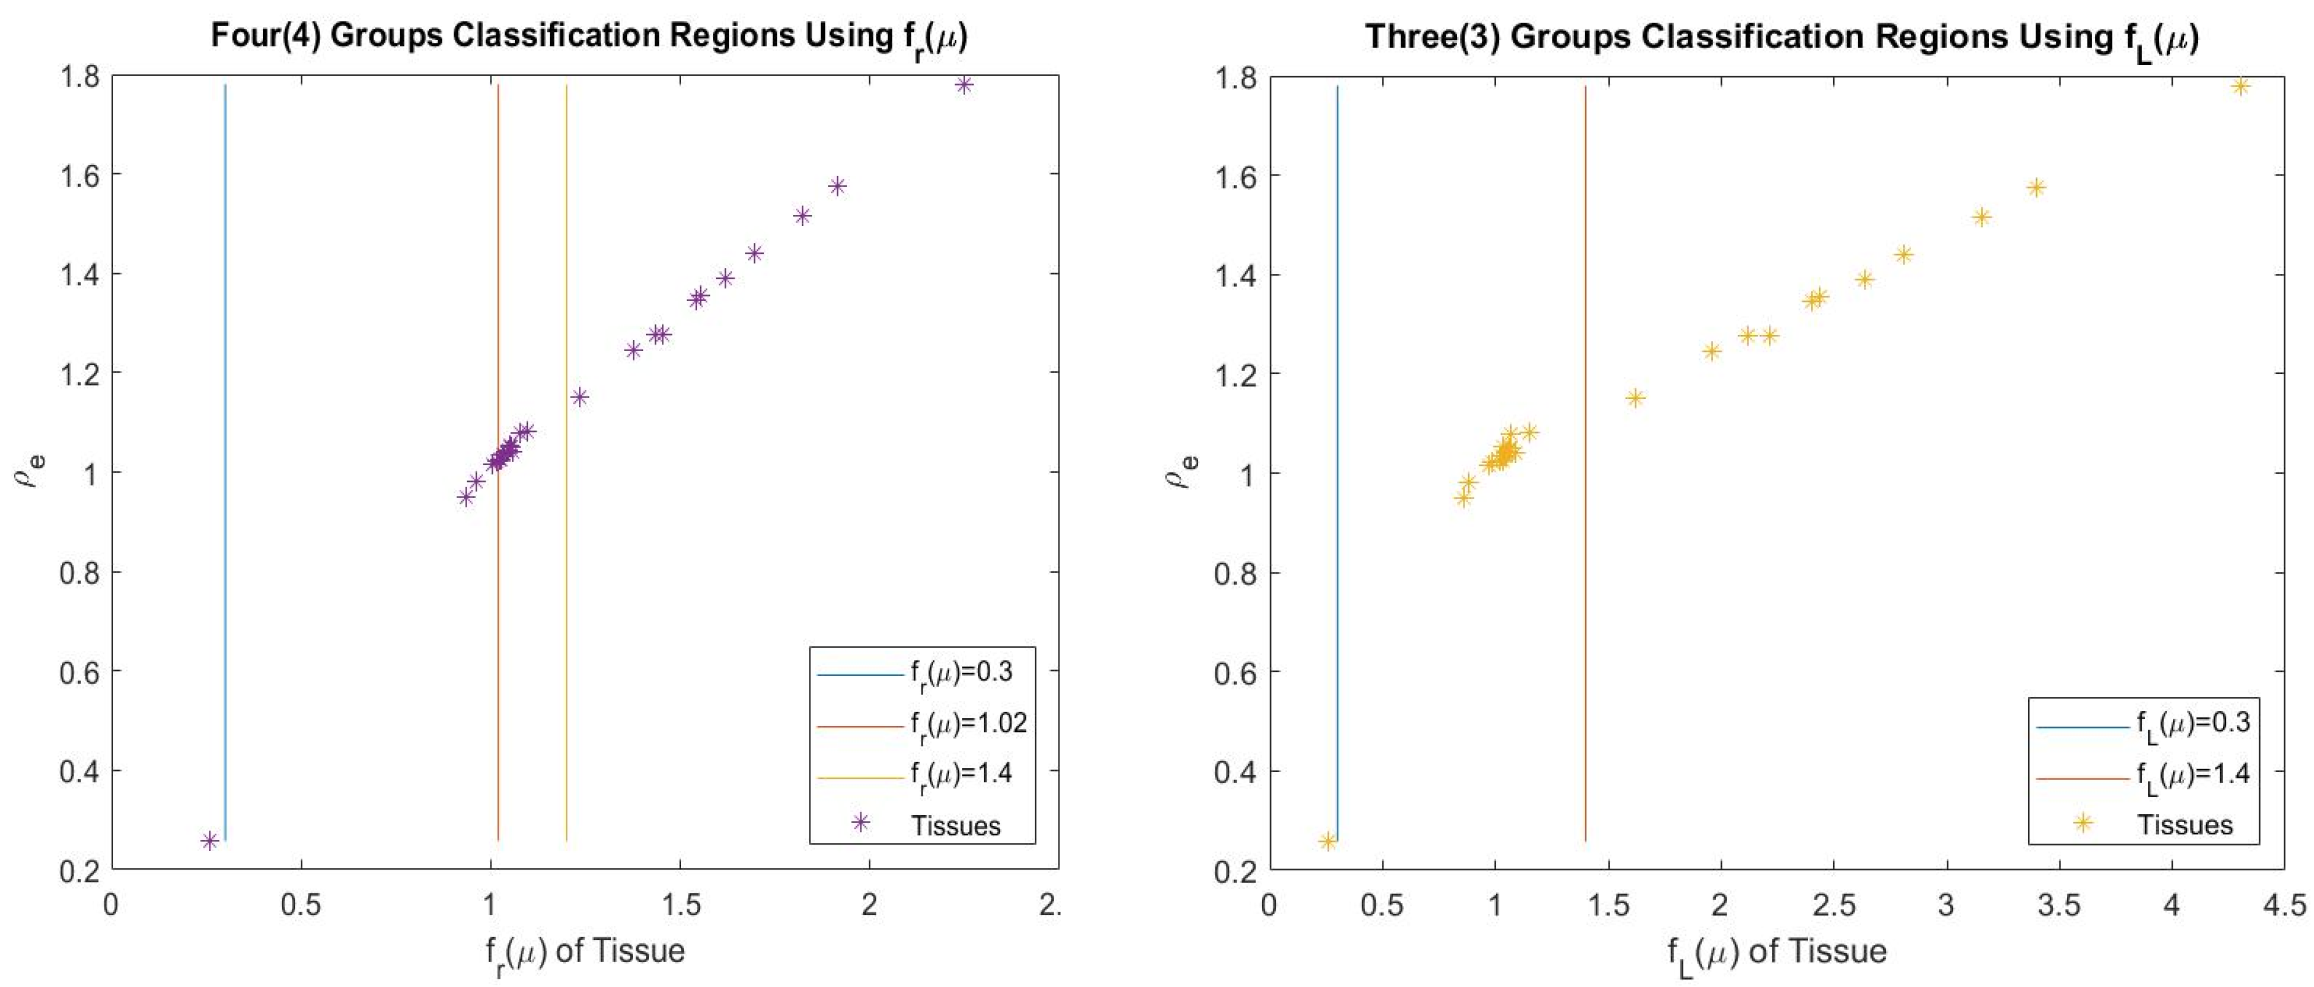
Figure 2 Tissue classification using f(μ).
A: Four regions of classification (lung tissues if fr ≤ 0.3, soft tissue 1 if 0.3 < fr ≤ 1.02, soft tissue 2 if 1.02 < fr ≤ 1.4, and bone tissue if fr > 1.4); B: Three regions of classification (lung tissues if fL ≤ 0.3, soft tissue if 0.3 < fL ≤ 1.4, and bone tissue if fL > 1.4). Citation: Chika CE. Machine Learning Approach and Model for Predicting Proton Stopping Power Ratio and Other Parameters Using Computed Tomography Images. J Med Phys 2024; 49: 519-530. Copyright© The Authors 2024. Published by Wolters Kluwer Medknow Publications. This article is available under the terms of the Creative Commons Attribution-NonCommercial-ShareAlike License (CC BY-NC-SA), which permits non-commercial use, distribution and reproduction in any medium, provided the original work is properly cited. Permission only needs to be obtained for commercial use.
- Citation: Chika CE. Advances in dual energy computed tomography approach for proton stopping power ratio computation in radiotherapy. World J Radiol 2025; 17(6): 105728
- URL: https://www.wjgnet.com/1949-8470/full/v17/i6/105728.htm
- DOI: https://dx.doi.org/10.4329/wjr.v17.i6.105728


