Copyright
©The Author(s) 2018.
World J Radiol. Dec 28, 2018; 10(12): 184-189
Published online Dec 28, 2018. doi: 10.4329/wjr.v10.i12.184
Published online Dec 28, 2018. doi: 10.4329/wjr.v10.i12.184
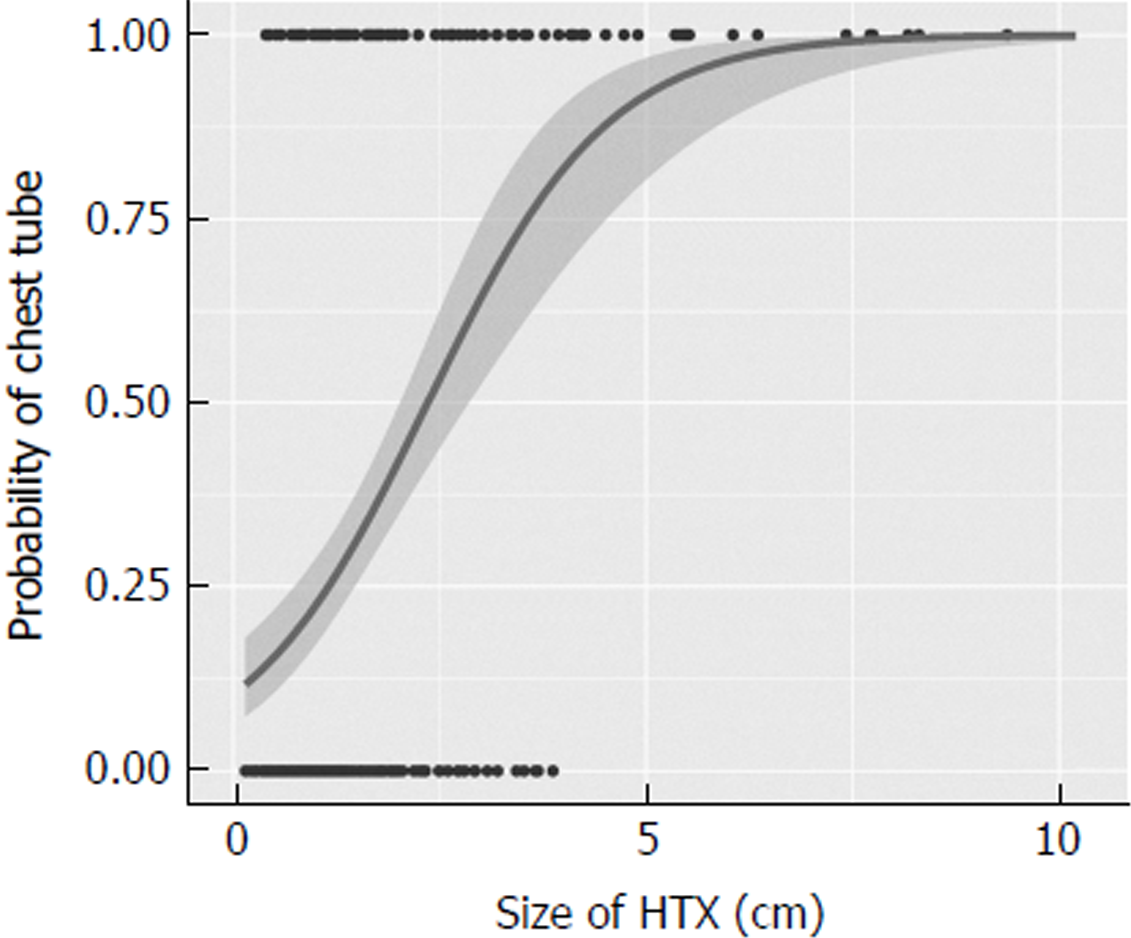
Figure 2 Predicted probability for tube thoracostomy.
The x-axis is the size of hemothorax and the y-axis is the probability of chest tube placement, which is either zero (no chest tubes) or one (chest tube placed). Each black dot represents a patient with a corresponding hemothorax size.
- Citation: Malekpour M, Widom K, Dove J, Blansfield J, Shabahang M, Torres D, Wild JL. Management of computed tomography scan detected hemothorax in blunt chest trauma: What computed tomography scan measurements say? World J Radiol 2018; 10(12): 184-189
- URL: https://www.wjgnet.com/1949-8470/full/v10/i12/184.htm
- DOI: https://dx.doi.org/10.4329/wjr.v10.i12.184


