Copyright
©2010 Baishideng.
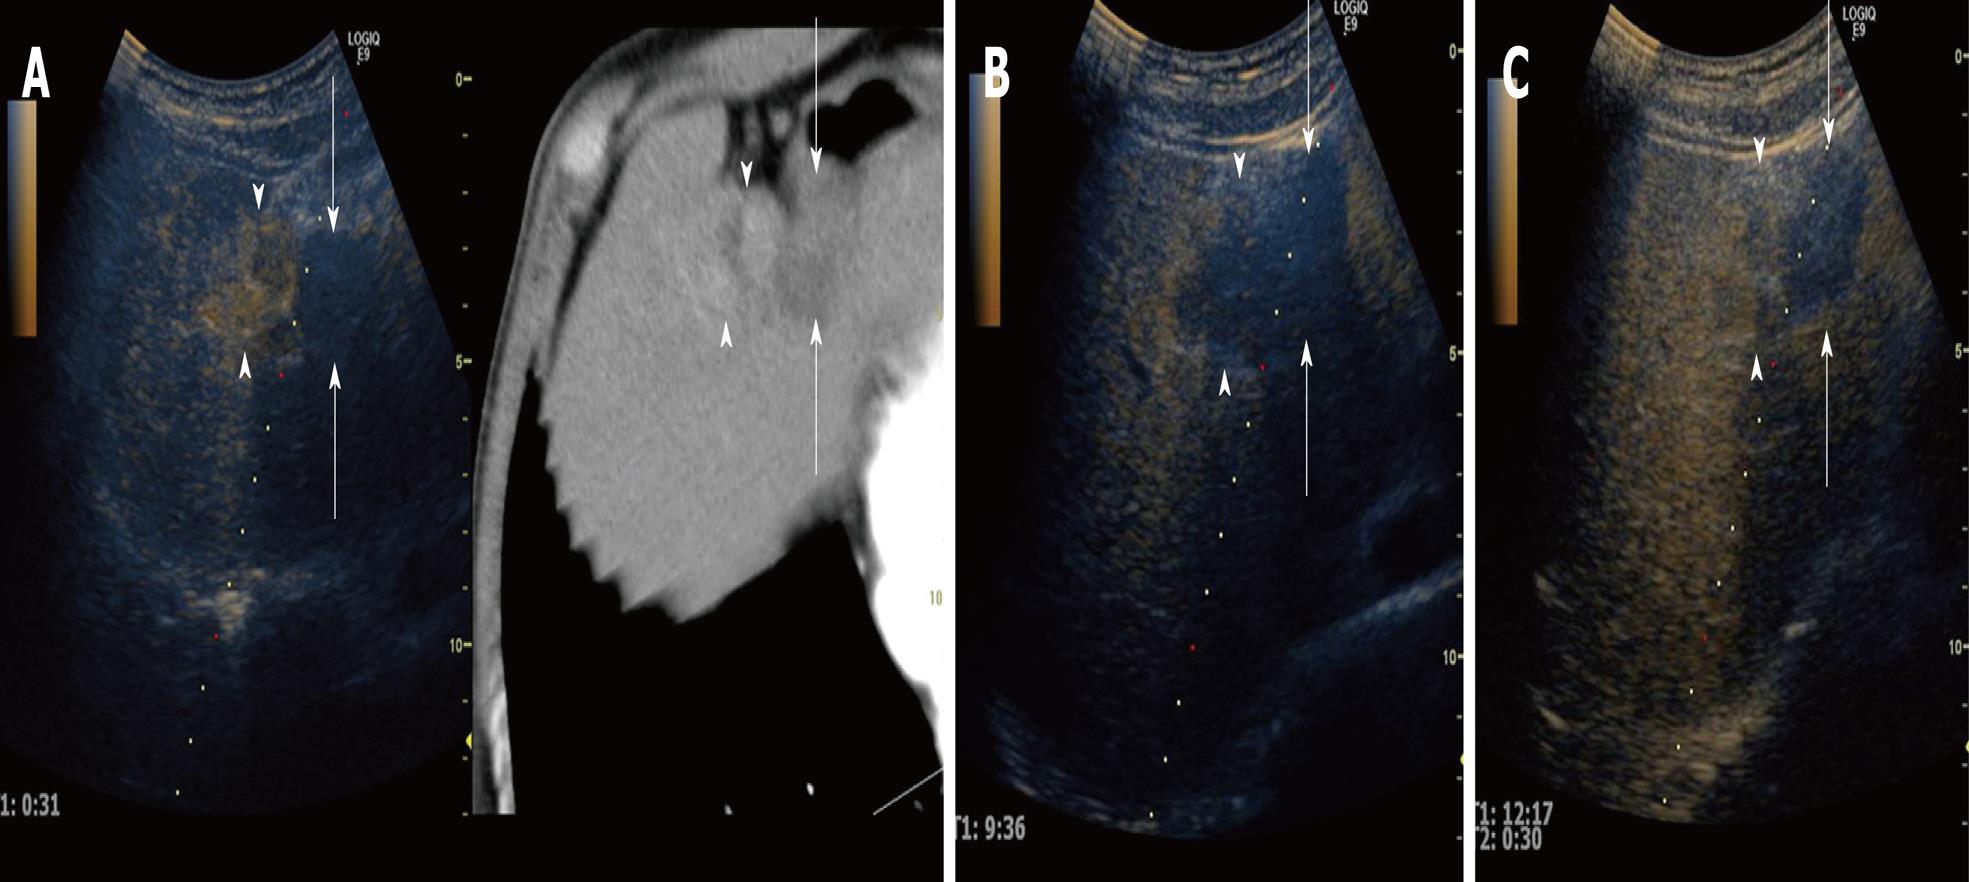
Figure 1 A 67-year-old man with recurrent HCC (maximum diameter 25 mm) in segment IV.
A: Fusion image combining arterial phase contrast-enhanced CT (right side) and early phase Sonazoid-enhanced US employing the coded phase inversion (CPI) mode at a low MI (left side). Arterial phase contrast-enhanced CT shows a high attenuation area (arrowheads) adjacent to the non-enhanced area treated by radiofrequency ablation (RFA) (arrows) in segment IV. Early phase Sonazoid-enhanced US by the CPI mode at a low MI shows homogeneous enhancement in the recurrent viable area (arrowheads) and no enhancement in the necrotic area (arrows). These enhanced and non-enhanced areas correspond well to the arterial phase contrast-enhanced CT; B: Late phase Sonazoid-enhanced US by CPI mode at a low MI shows a perfusion defect (wash out) in both the recurrent viable area and the necrotic area (arrowheads). It is difficult to differentiate between the necrotic and viable areas because both appear as a perfusion defect; C: Defect on re-perfusion image with Sonazoid-enhanced US by the CPI mode at a low MI shows tumor enhancement in the recurrent viable area which previously showed a perfusion defect in the late phase (see B) (arrowheads). The necrotic area appears as a perfusion defect (arrows).
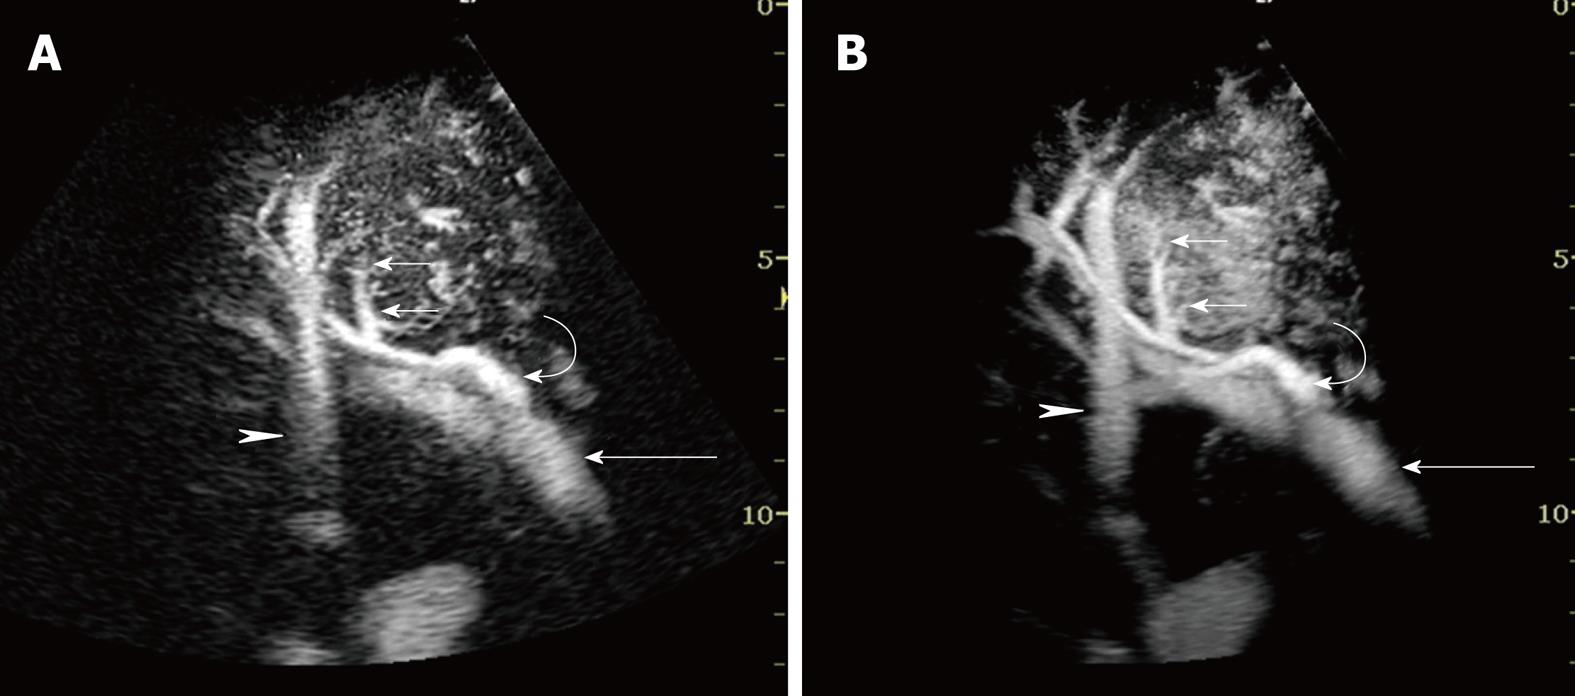
Figure 2 A 76-year-old man with HCC (maximum diameter 40 mm) in segment VIII.
A: Early phase Sonazoid-enhanced US by CHA mode at a high MI shows intratumoral vessels (small arrows), right portal vein (arrow), hepatic artery (curved arrow), and hepatic vein (arrowhead); B: Accumulation maximum intensity holding image in the early phase. Sonazoid-enhanced US by CHA mode at a high MI more clearly shows the serial images of intratumoral vessels (small arrows), right portal vein (arrow), hepatic artery (curved arrow), and hepatic vein (arrowhead) than the images in A.
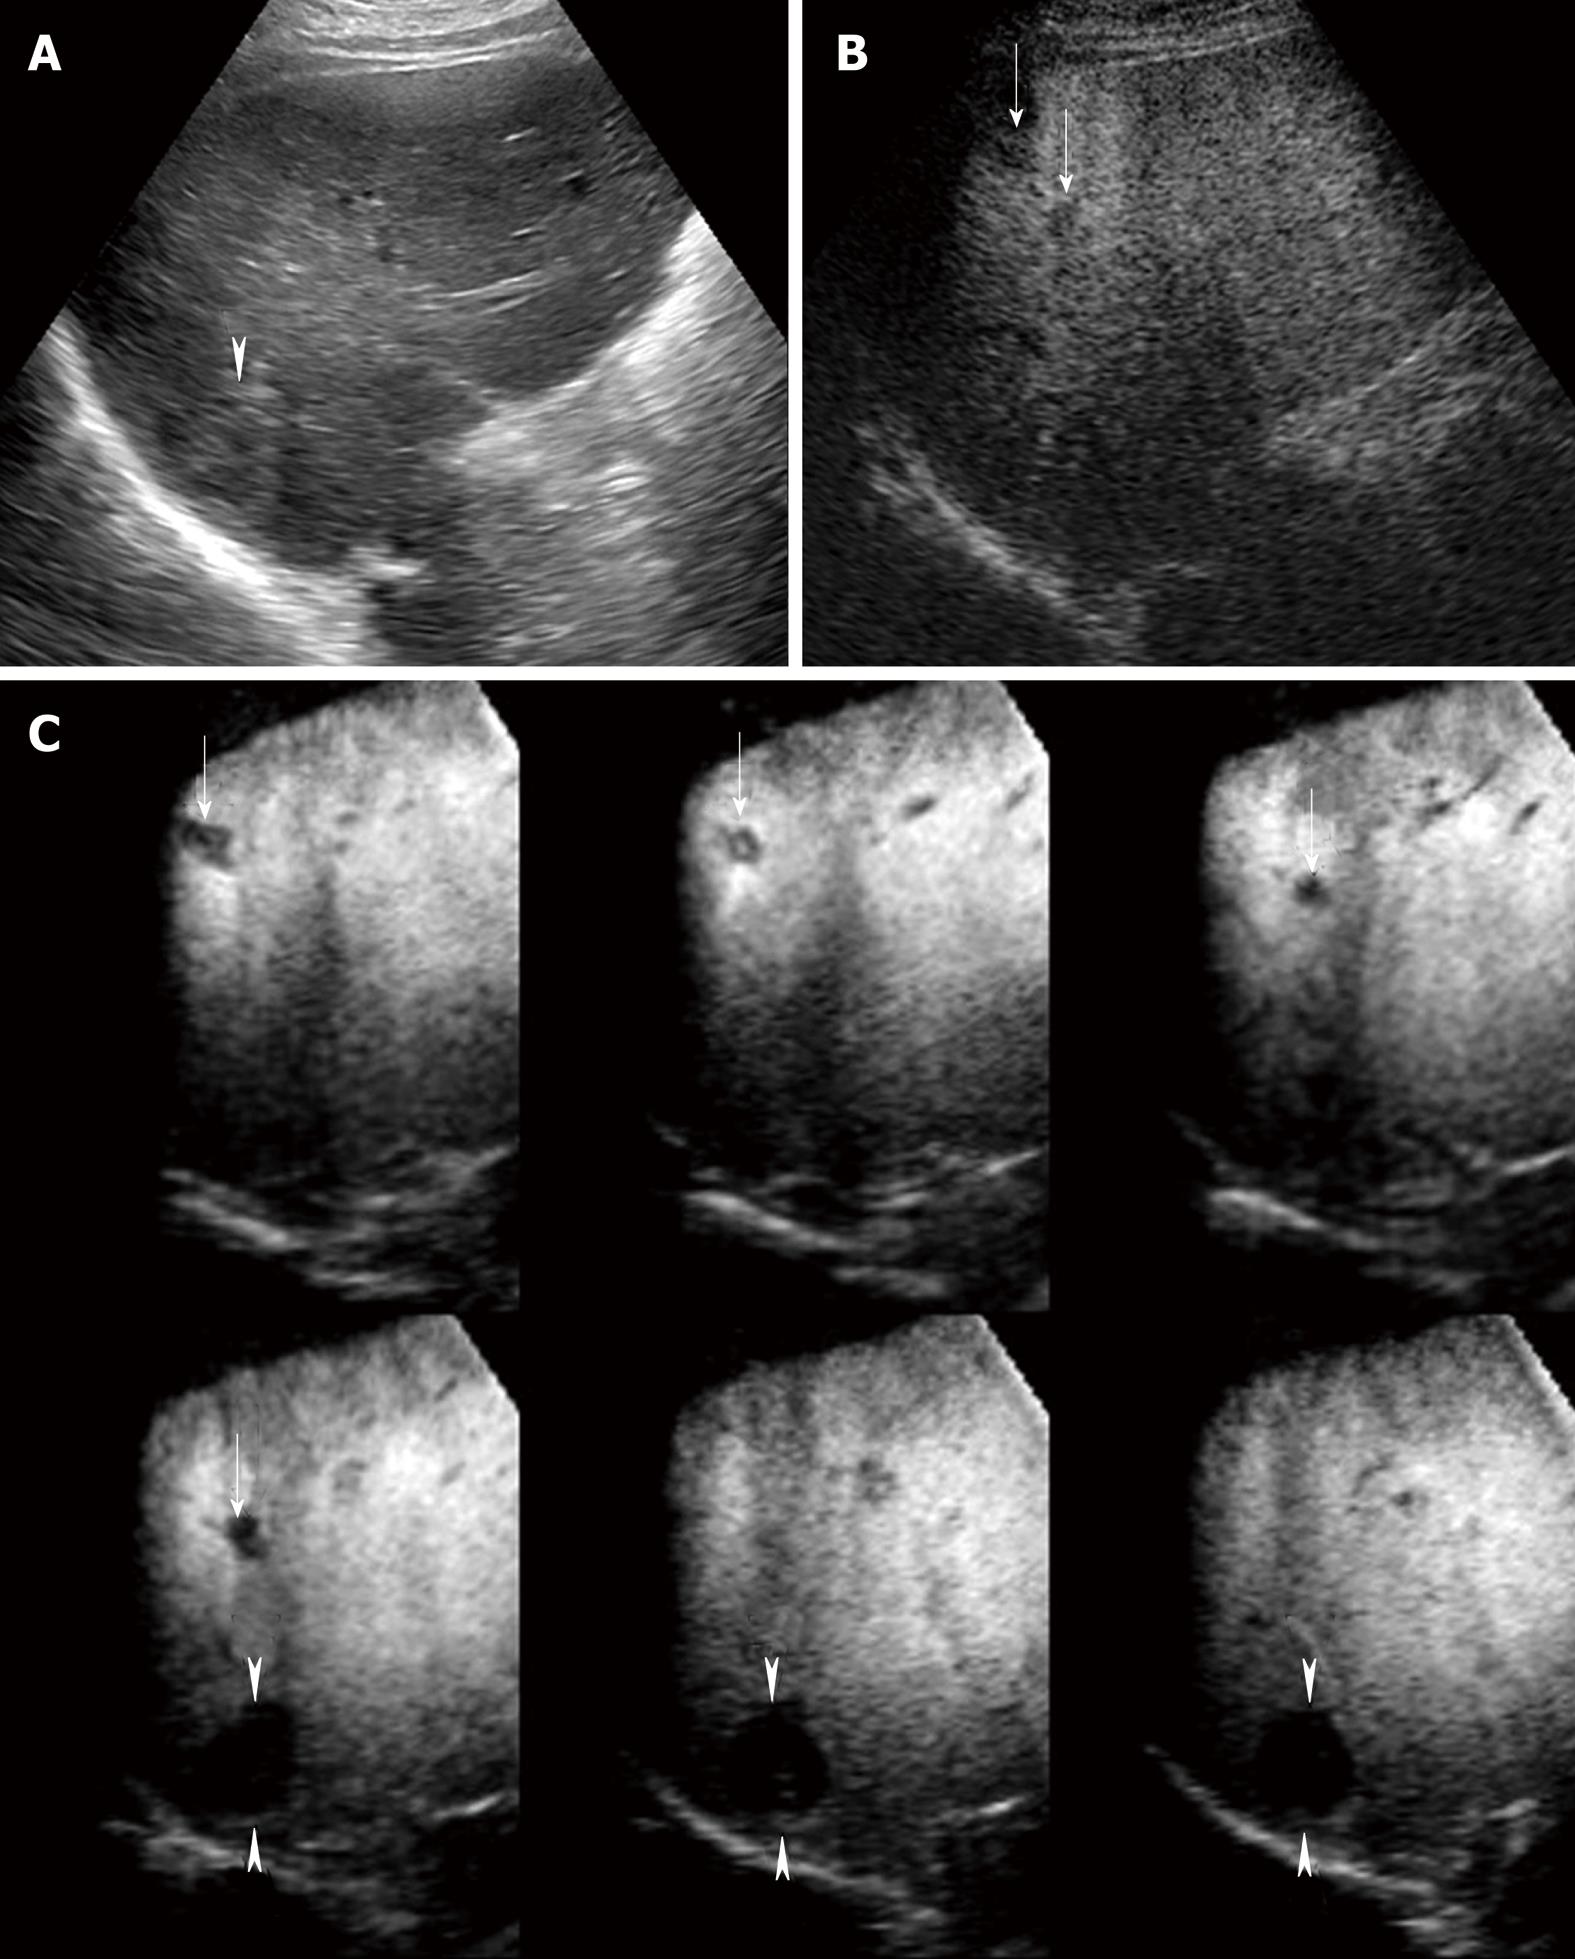
Figure 3 A 75-year-old man with multiple HCC lesions (maximum diameter 22 mm, 12 mm and 10 mm, respectively) in segment VI.
A: Conventional US shows one hyper-echoic HCC lesion alone; B: Late phase Sonazoid-enhanced US by CPI mode at a low MI shows two perfusion defects not detected by conventional US (arrows). However, one hyper-echoic lesion located in the deep portion far from the skin surface cannot be visualized by Sonazoid-enhanced US by CPI mode at a low MI; C: Late phase Sonazoid-enhanced 3D US by CHA mode at a high MI shows three HCC lesions as clear perfusion defects, as depicted on tomographic ultrasound images in plane A, which can be translated from front to back (arrows and arrowheads). The hyper-echoic HCC lesion which was not detected by Sonazoid-enhanced US at a low MI is clearly seen (arrowheads).
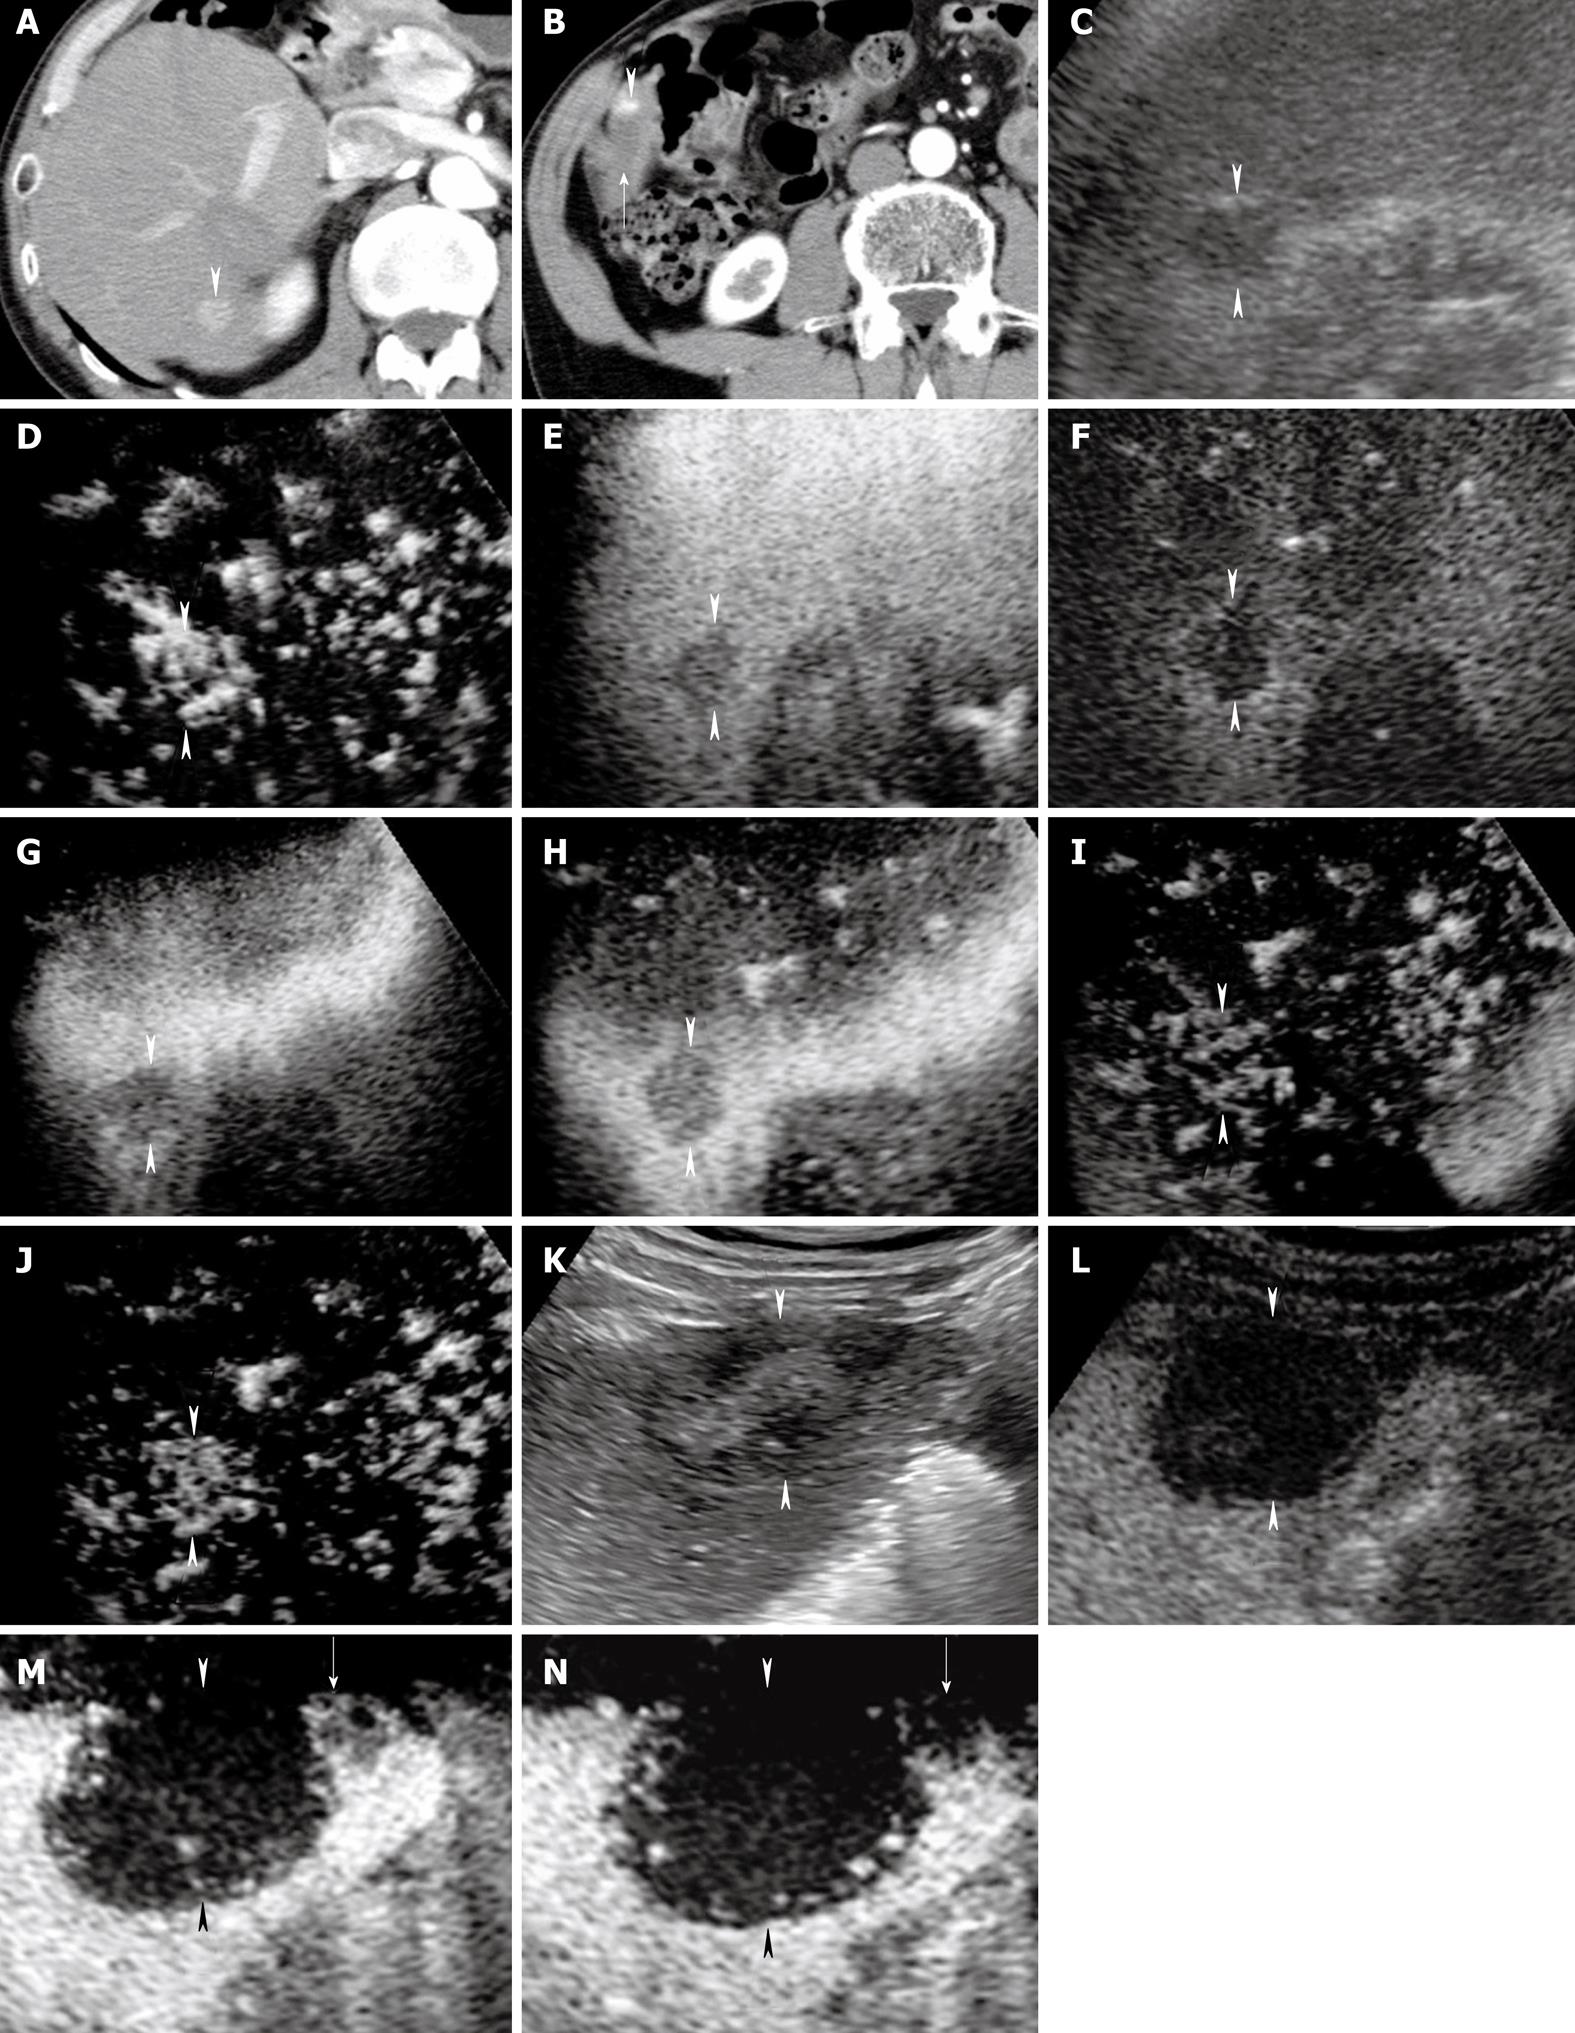
Figure 4 A 70-year-old man with newly developed HCC (maximum diameter 15 mm) in segment VI and residual viable lesion in segment V (maximum diameter 8 mm).
A-B: Arterial phase contrast-enhanced CT shows a high attenuation area in segment VI (arrowhead) (A) and a high attenuation area (arrowhead) adjacent to the non-enhanced area (arrow) in segment V (B); C: Conventional US shows a hypo-echoic tumor in segment VI (arrowheads); D: Early phase Sonazoid-enhanced US by CHA mode at a high MI shows intratumoral vessels and homogeneous tumor enhancement (arrowheads); E: Middle phase Sonazoid-enhanced US by CHA mode at a high MI shows slightly hypo-echoic (wash out) but homogeneous tumor enhancement (arrowheads); F: Late phase Sonazoid-enhanced US by CPI mode at a low MI shows a perfusion defect (wash out) (arrowheads); G-J: Late phase Sonazoid-enhanced US by CHA mode on a high MI intermittent image shows a perfusion defect (G, H) (arrowheads). Intratumoral vessels (I) and homogeneous enhancement (J) are then seen later (arrowheads); K: Conventional US shows a hypo-echoic tumor in segment V (arrowheads); L: Late phase Sonazoid-enhanced US by CPI mode at a low MI shows a perfusion defect (arrowheads). It is difficult to differentiate between the necrotic and viable areas because both appear as a perfusion defect. The normal liver parenchyma is enhanced; M-N: Late phase Sonazoid-enhanced US by CHA mode at a high MI shows intratumoral vessels in the right side of the lesion (viable area) (arrow) and no enhancement in the left side of the lesion (necrotic area). Arrowheads indicate the margin of the lesion. This enhanced area corresponds closely to the area of high attenuation seen in B.
Figure 5 A 67-year-old woman with newly developed HCC (maximum diameter 12 mm) in segment V.
A: Conventional US shows no evidence of tumor; B: Late phase Sonazoid-enhanced US by CPI mode at a low MI shows a perfusion defect (arrowheads); C-D:Late phase Sonazoid-enhanced US by CHA mode on a high MI intermittent image shows a perfusion defect (C) (arrowheads). Intratumoral vessels (D) are seen later (arrowheads). This lesion was treated with percutaneous RFA guided by late phase Sonazoid-enhanced US by CPI mode at a low MI; E-F: Arterial phase contrast-enhanced CT shows a high attenuation area in segment V before RFA (arrowheads) (E). Arterial phase contrast-enhanced CT obtained 4 weeks after treatment shows a low attenuation area (arrowhead) (F). This low attenuation area is larger than that of high attenuation seen in E.
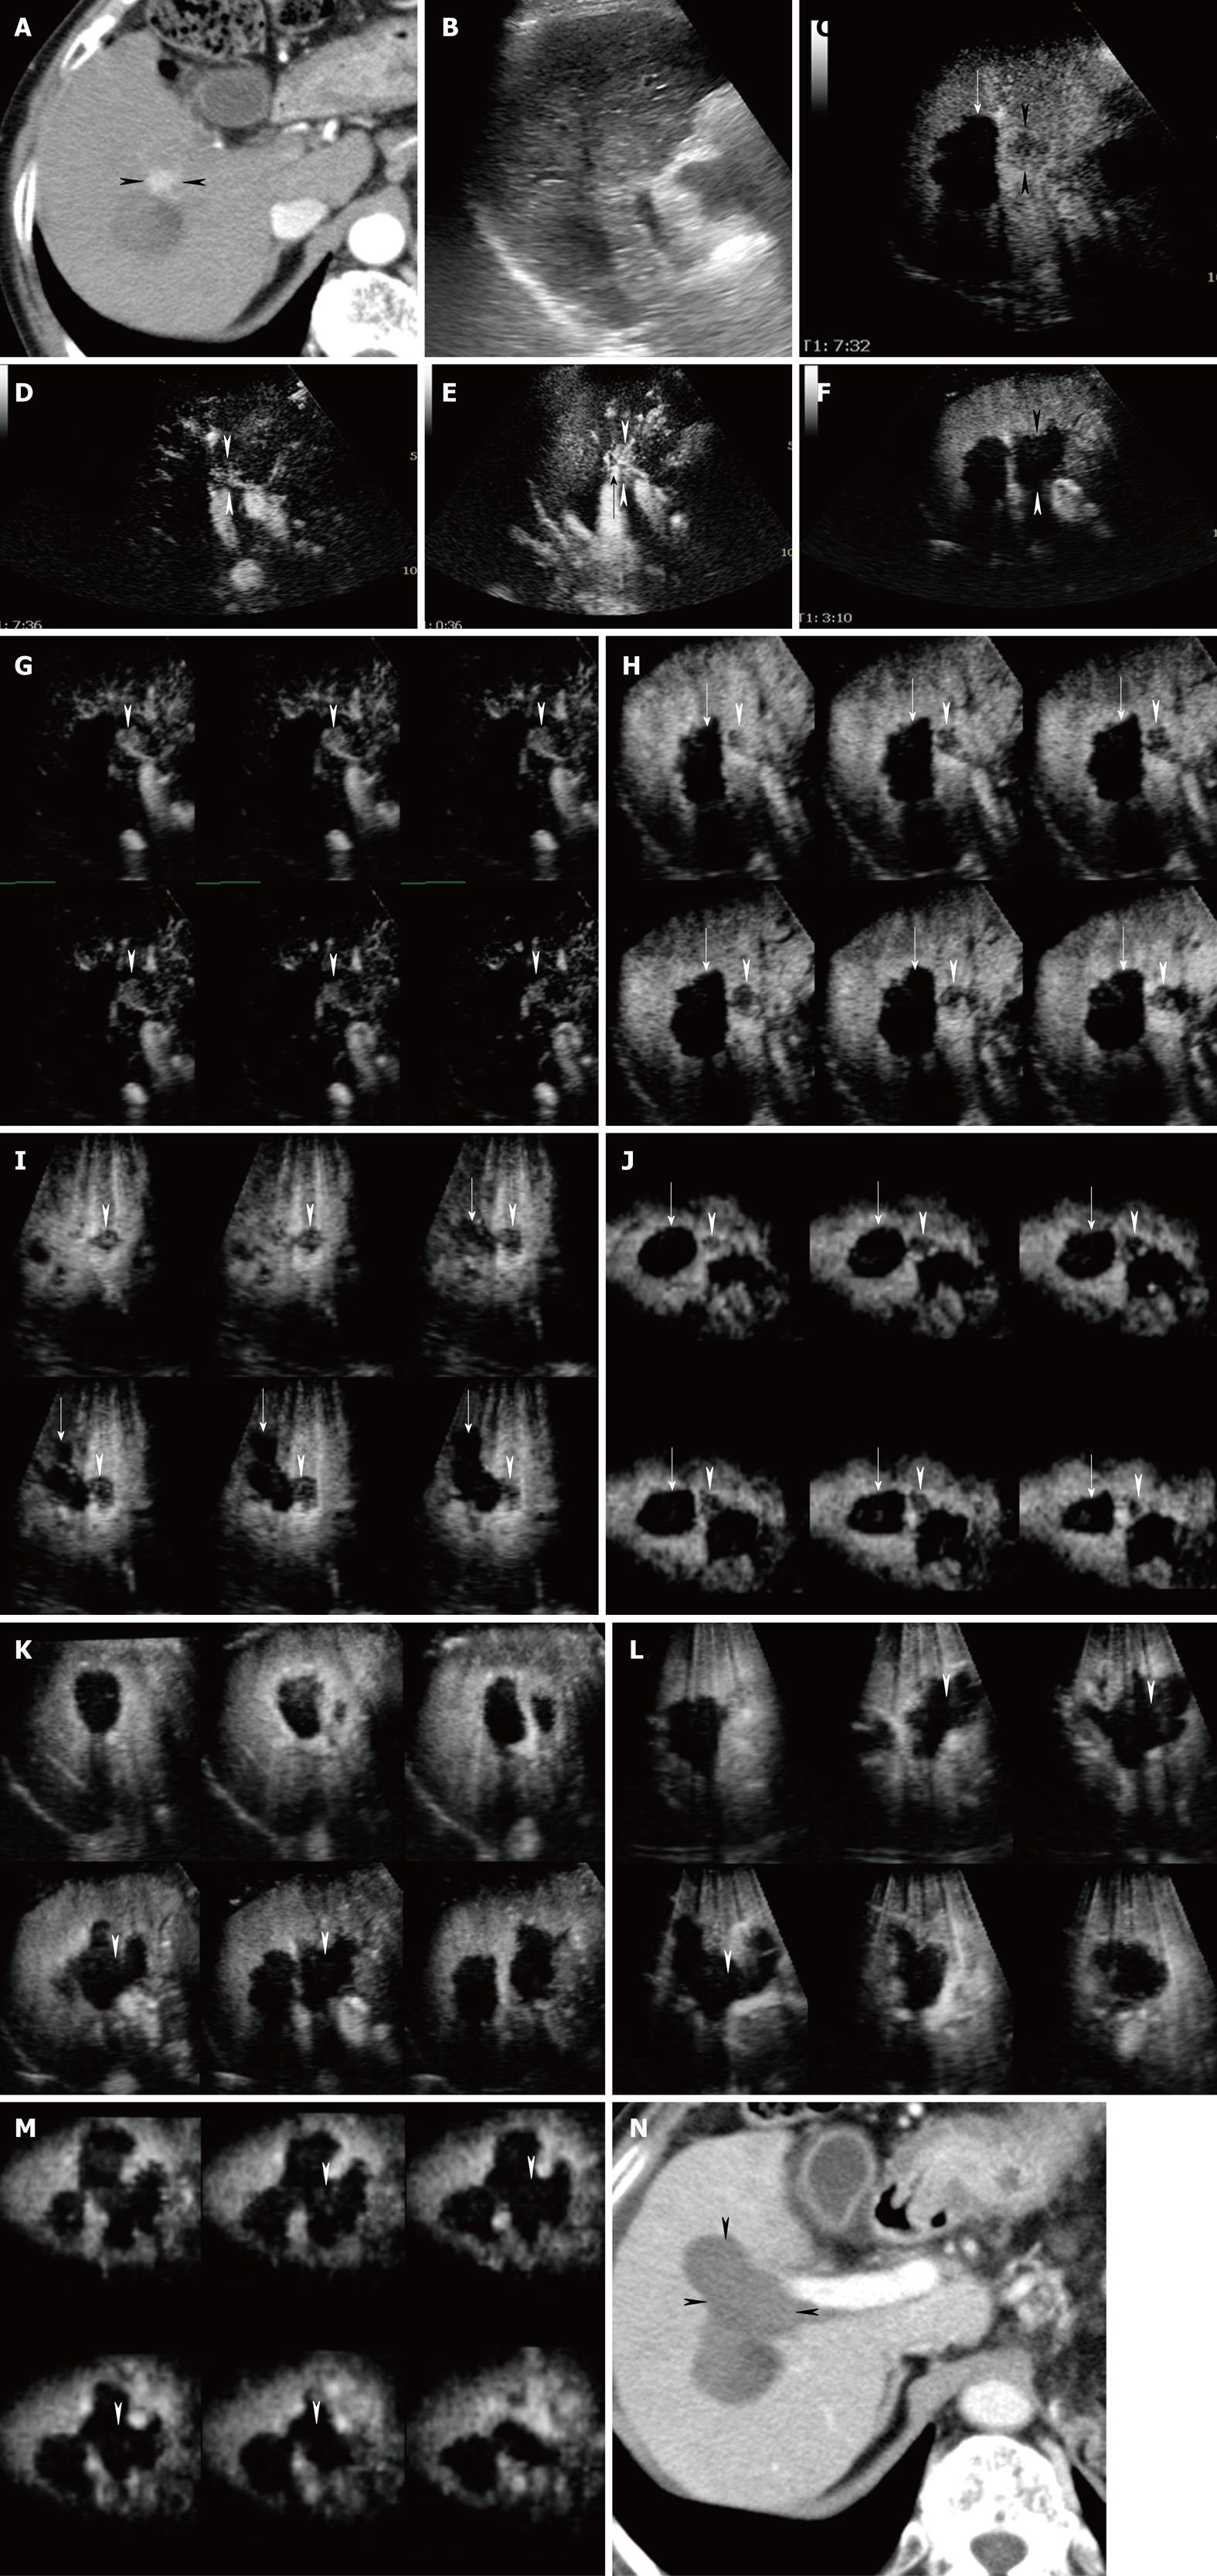
Figure 6 A 75-year-old woman with newly developed HCC (maximum diameter 15 mm) in segment VIII.
A: Arterial phase contrast-enhanced CT shows a high attenuation area in segment VIII (arrowheads); B: Conventional sonogram cannot pinpoint the location of a tumor; C: Late phase Sonazoid-enhanced US by CHA mode on a high MI intermittent image shows a perfusion defect (arrowheads). Intratumoral vessels are faintly visible. Note the non-enhanced area caused by previous percutaneous RFA therapy (arrow); D: Late phase Sonazoid-enhanced US by CHA mode at a high MI intermittent image shows intratumoral vessels (arrowheads); E: Early phase Sonazoid-enhanced US CHA mode on a high MI shows homogeneous tumor enhancement (arrowheads) and the tip of the RFA electrode (arrow) in the tumor; F: Middle phase Sonazoid-enhanced US obtained 1 d after RFA guided by early phase Sonazoid-enhanced US shows the tumor as a perfusion defect with an oval shape and distinct margins (arrowheads). This non-enhanced area is larger than the area of tumor enhancement seen in C or D. Normal liver parenchyma is enhanced; G-J: Sonazoid-enhanced 3D US images show that before RFA the HCC lesion located adjacent to the right anterior portal vein is distinctly enhanced in the early phase (arrowheads), as shown on tomographic ultrasound images in plane A, which can be translated from front to back (G). Late phase Sonazoid-enhanced 3D US images show that the HCC lesion and areas previously treated by RFA appear as perfusion defects (arrowheads) and completely non-enhanced areas (arrows), respectively, as shown on tomographic ultrasound images in plane A, which can be translated from front to back (H), plane B, which can be translated from right to left (I), and plane C, which can be translated from down to up (J); K-M: One day after RFA treatment, adequate ablation in the absence of enhancement was detected as shown in the middle phase on the tomographic ultrasound images in plane A, which can be translated from front to back (K), plane B, which can be translated from right to left (L), and plane C, which can be translated from down to up (M). Arrowheads indicate the HCC lesion margin, as seen in G or H-J. This non-enhanced area is larger than the areas seen in G or H-J. Normal liver parenchyma is enhanced; N: Arterial phase contrast-enhanced CT obtained 4 wk after treatment shows a low attenuation area (arrowhead). This low attenuation is larger than the area of high attenuation seen in A.
Figure 7 A 72-year-old man with large HCC (maximum diameter 90 mm) in the right lobe of the liver.
A-C: Sonographic angiograms acquired by Sonazoid-enhanced 3D US and rendered by maximum intensity with gray surface mode, presented in different directions, and the tumor had tortuous intratumoral vessels. Middle and right hepatic veins are also seen (arrows). An arrowhead points to the margins of the tumor; D: Surgical specimen shows a large HCC lesion located in the right lobe of the liver (arrowheads). Histological specimen shows moderately to poorly differentiated HCC.
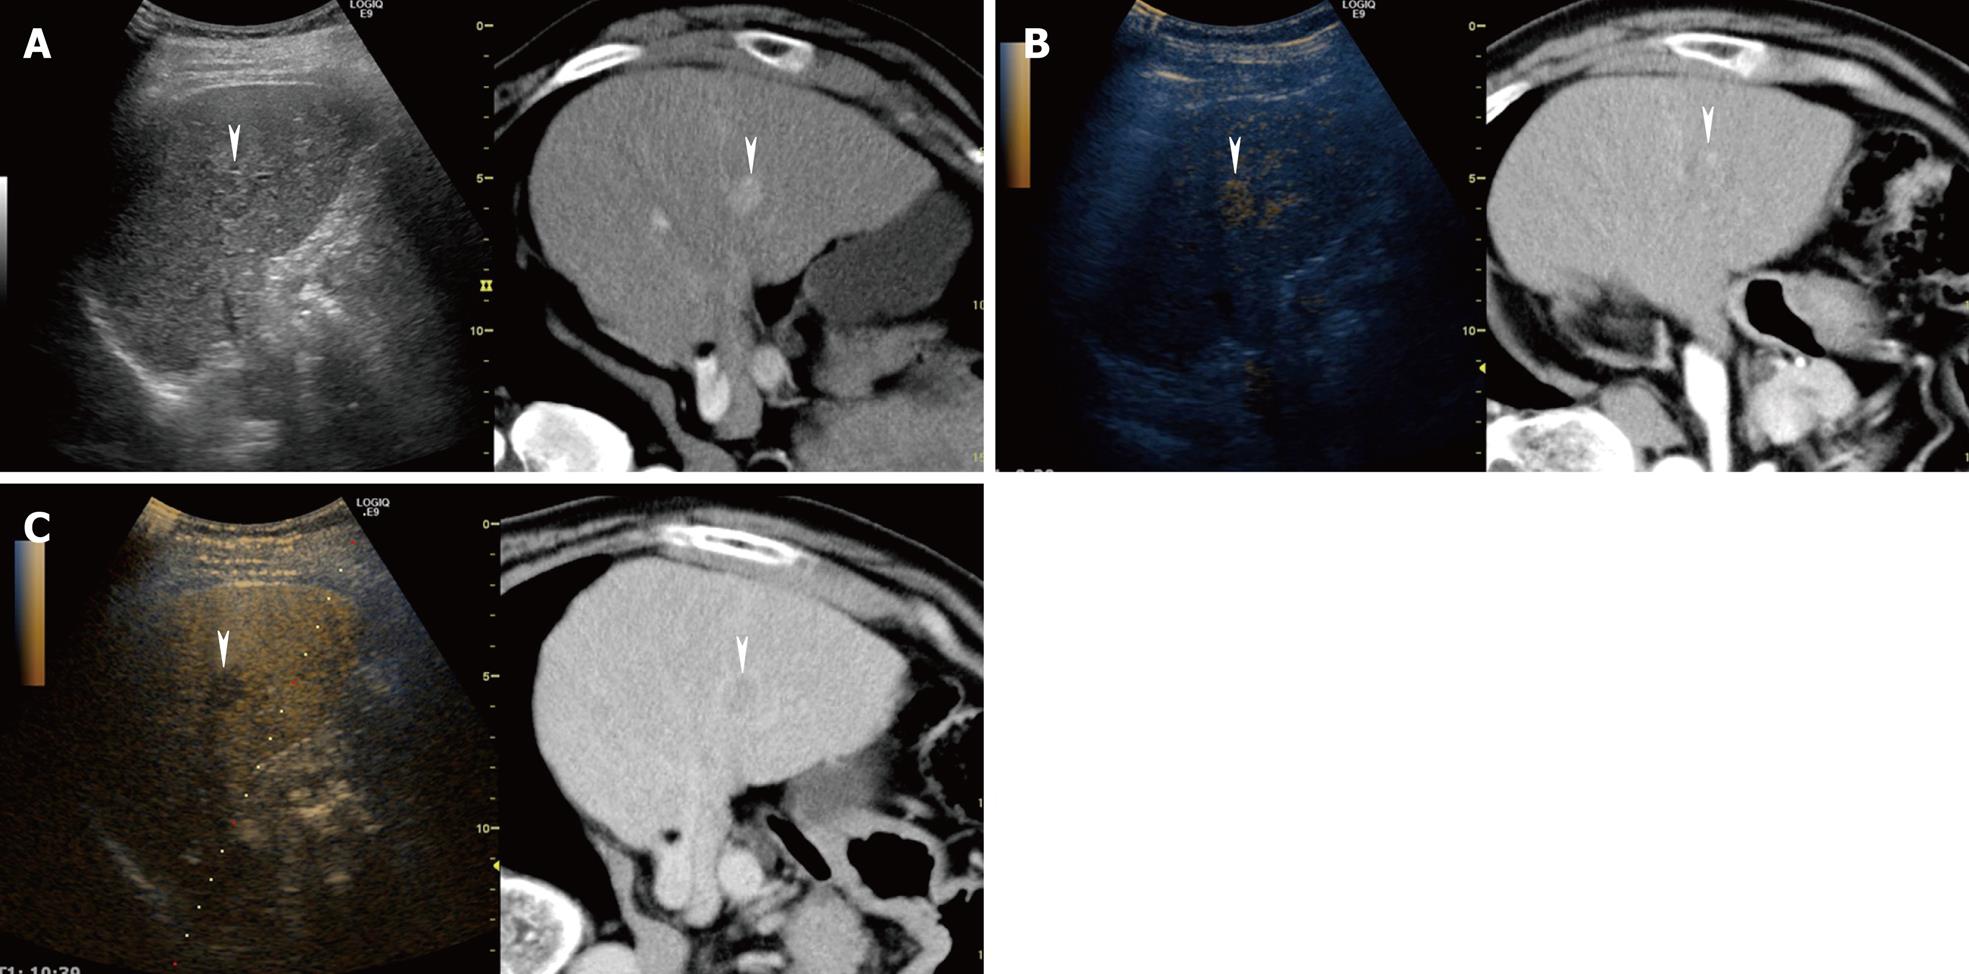
Figure 8 A 66-year-old man with newly developed HCC (maximum diameter 15 mm) in segment V.
A: Fusion image combining arterial phase contrast-enhanced CT (right side) and conventional US (left side). Due to advanced liver cirrhosis, the echogenicity of the liver parenchyma is heterogeneous. Arterial phase contrast-enhanced CT shows a high attenuation area in segment V (arrowheads). Arterial phase contrast-enhanced CT as the reference standard, allows conventional US to detect the target HCC lesion easily; B: Fusion image combining arterial phase contrast-enhanced CT (right side) and early phase Sonazoid-enhanced US at a low MI (left side). Early phase Sonazoid-enhanced US at a low MI shows a homogeneous enhancement in segment V (arrowhead). This enhanced area corresponds well to a high attenuation area, as shown on the arterial phase contrast-enhanced CT image (arrowhead); C: Fusion image combining late phase contrast-enhanced CT (right side) and late phase Sonazoid-enhanced US at a low MI (left side). Late phase Sonazoid-enhanced US at a low MI shows a perfusion defect in a viable HCC lesion (arrowhead). This perfusion defect corresponds well to a low attenuation area, as shown on the late phase contrast-enhanced CT.
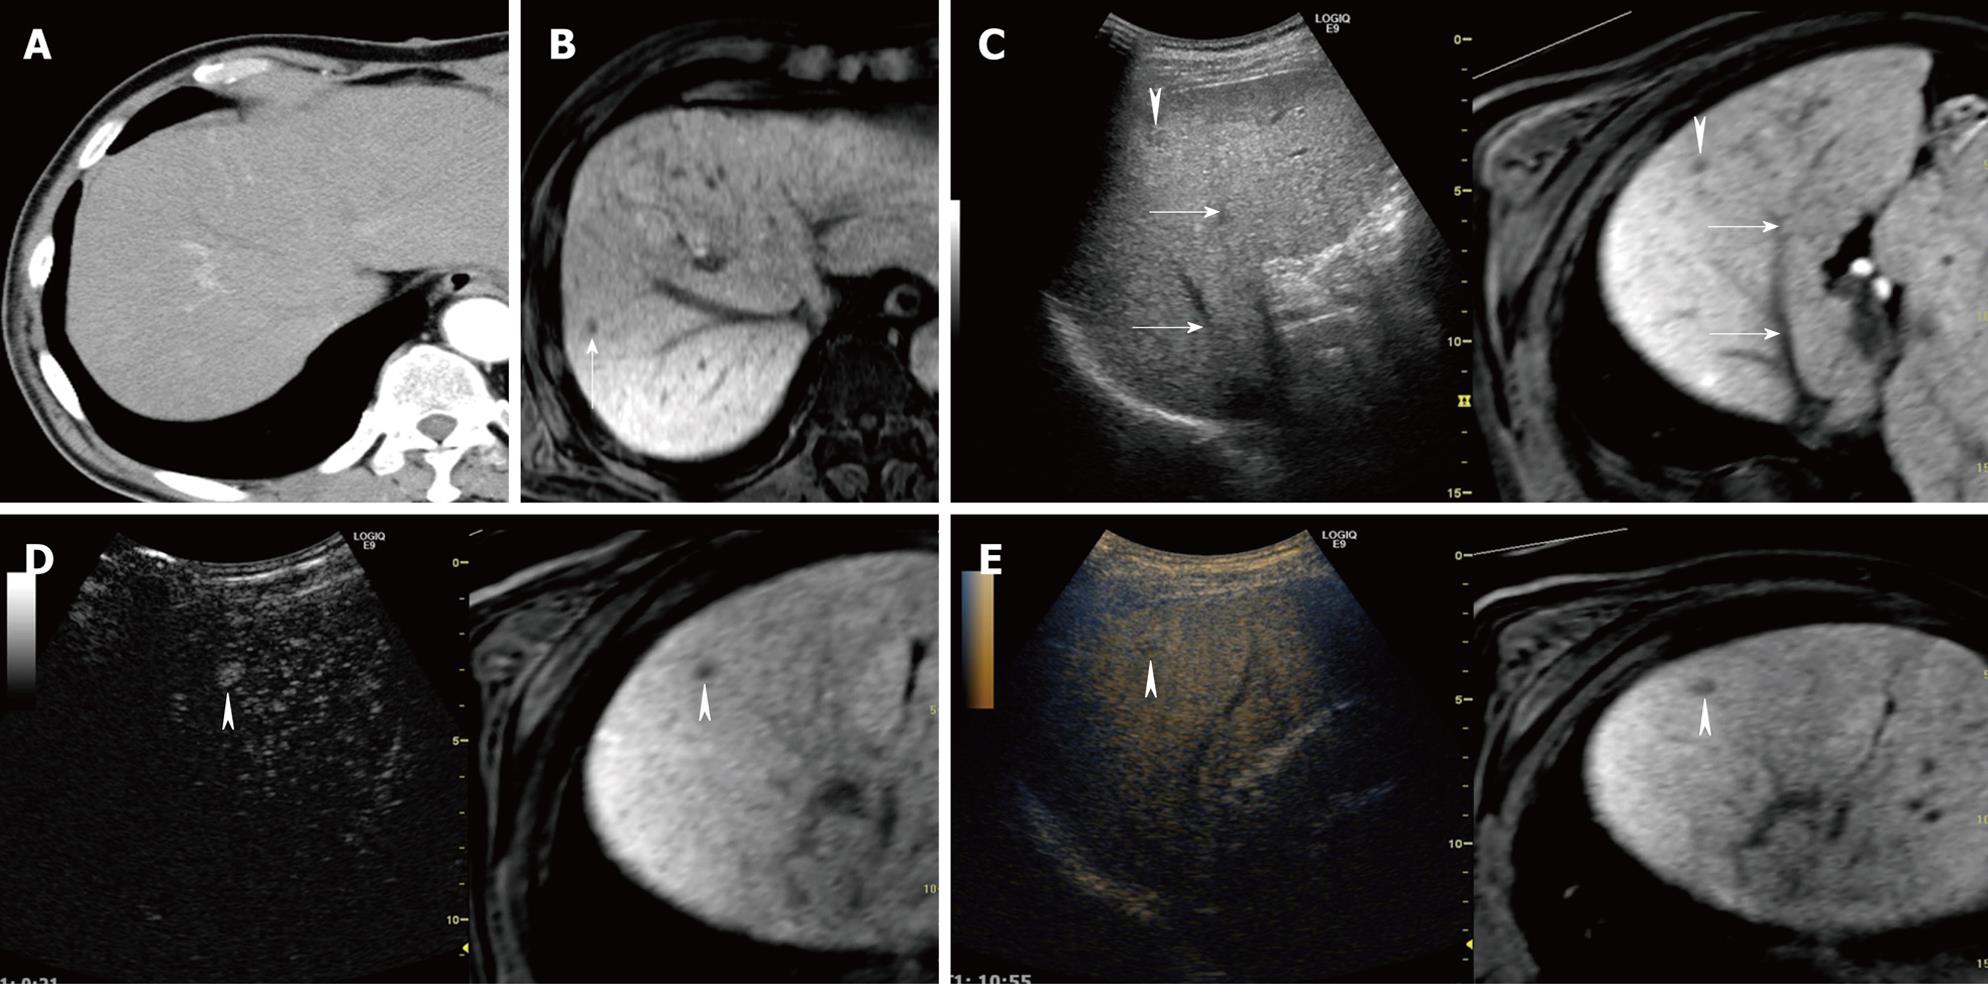
Figure 9 A 58-year-old man with newly developed HCC (maximum diameter 10 mm) in segment VIII.
A: Arterial phase contrast-enhanced CT can not detect a tumor; B:Hepatobiliary phase contrast-enhanced MRI with gadolinium-ethoxybenzyl-diethylenetriamine (Gd-EOB-DTPA) obtained at 20 min after injection shows a hypo-intense area in segment VIII (arrow); C: Fusion image combining hepatobiliary phase contrast-enhanced MRI with Gd-EOB-DTPA (right side) and conventional US (left side). Hepatobiliary phase contrast-enhanced MRI with Gd-EOB-DTPA shows a hypo-intense area in segment VIII. Hepatobiliary phase contrast-enhanced MRI with Gd-EOB-DTPA as the reference standard, allows conventional US to detect the target HCC lesion easily (arrowhead). Arrows indicate the hepatic vein; D: Fusion image combining hepatobiliary phase contrast-enhanced MRI with Gd-EOB-DTPA (right side) and early phase Sonazoid-enhanced US at a low MI (left side). Early phase Sonazoid-enhanced US at a low MI shows a small homogeneous enhancement in segment VIII (arrowhead). This enhanced area corresponds to a hypo-intense area, as shown on hepatobiliary phase contrast-enhanced MRI with a Gd-EOB-DTPA image (arrowhead); E: Fusion image combining hepatobiliary phase contrast-enhanced MRI with Gd-EOB-DTPA (right side) and late phase Sonazoid-enhanced US at a low MI (left side). Late phase Sonazoid-enhanced US at a low MI shows a small perfusion defect in segment VIII (arrowhead). This area corresponds to a hypo-intense area, as shown on hepatobiliary phase contrast-enhanced MRI with Gd-EOB-DTPA image (arrowhead).
Figure 10 A 77-year-old woman with newly developed HCC (maximum diameter 12 mm) in segment VIII.
A: Fusion image combining arterial phase contrast-enhanced CT (right side) and conventional US (left side). Arterial phase contrast-enhanced CT shows hypo-attenuation area previously treated by RFA alone (arrow). Conventional US shows two hypo-echoic lesions. One is an HCC lesion which was previously treated by RFA (arrow) and the other is a new HCC lesion which was not detectable by dynamic CT (arrowhead); B: Fusion image combining hepatobiliary phase contrast-enhanced MRI with Gd-EOB-DTPA (right side) and middle phase Sonazoid-enhanced US at a low MI (left side). Hepatobiliary phase contrast-enhanced MRI with Gd-EOB-DTPA shows a small hypo-intense area in segment VIII (arrowhead). Middle phase Sonazoid-enhanced US obtained 1 d after RFA shows the tumor as a perfusion defect. This non-enhanced area is larger than the hypo-echoic lesion seen on the hepatobiliary phase contrast-enhanced MRI with Gd-EOB-DTPA. Normal liver parenchyma is enhanced.
- Citation: Numata K, Luo W, Morimoto M, Kondo M, Kunishi Y, Sasaki T, Nozaki A, Tanaka K. Contrast enhanced ultrasound of hepatocellular carcinoma. World J Radiol 2010; 2(2): 68-82
- URL: https://www.wjgnet.com/1949-8470/full/v2/i2/68.htm
- DOI: https://dx.doi.org/10.4329/wjr.v2.i2.68


