Copyright
©The Author(s) 2021.
World J Radiol. Oct 28, 2021; 13(10): 327-343
Published online Oct 28, 2021. doi: 10.4329/wjr.v13.i10.327
Published online Oct 28, 2021. doi: 10.4329/wjr.v13.i10.327
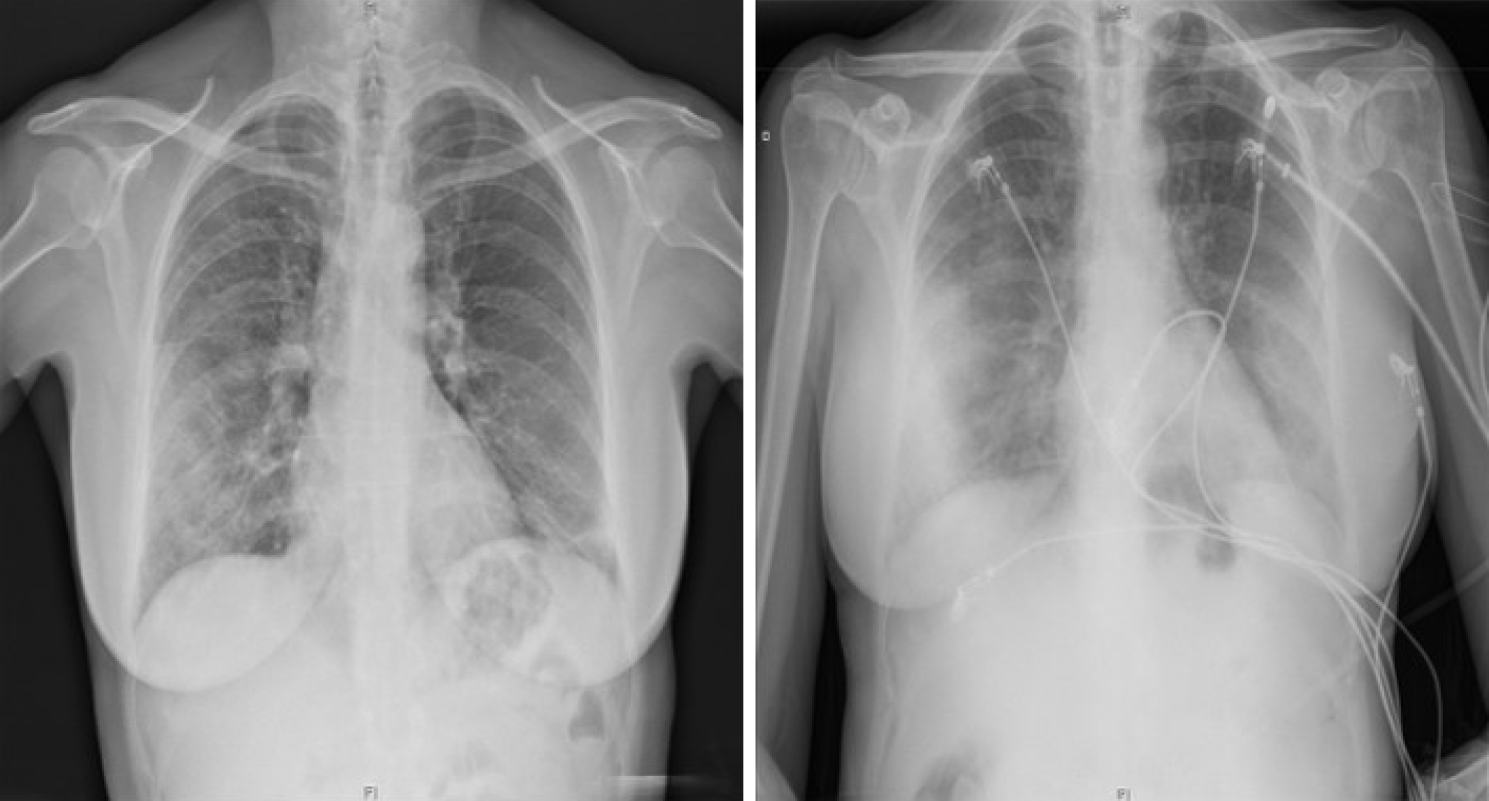
Figure 1 Chest X-ray findings in a 60-year-old woman with confirmed severe acute respiratory syndrome coronavirus-2 pneumonia (positive RT-PCR test).
PA X-ray (left) with patchy right mid-to-lower and left lower lung opacities. AP X-ray (right) with peripherally distributed bilateral lung opacities.
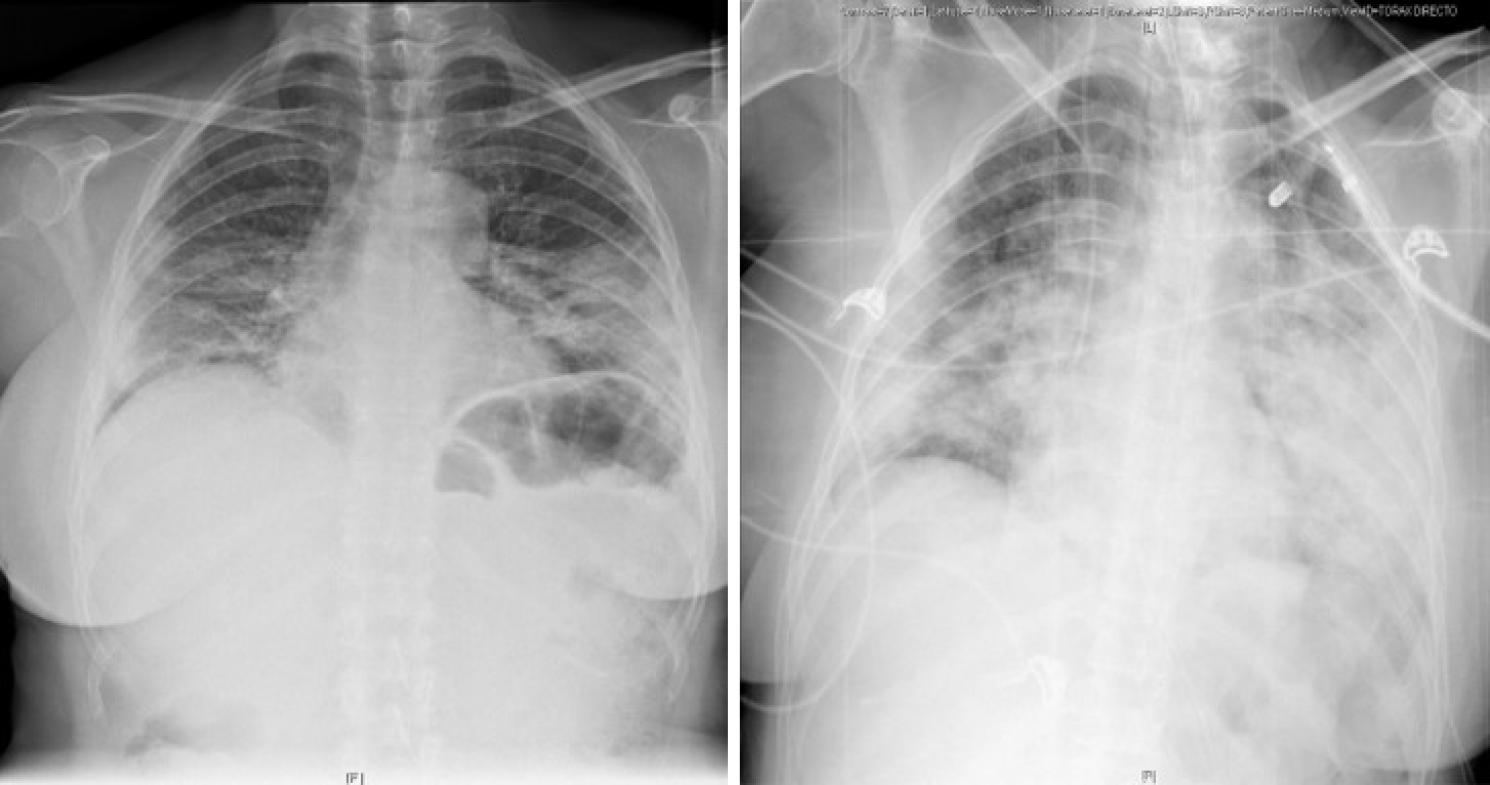
Figure 2
PA Chest X-ray findings in a 55-year-old woman with varying degrees of coronavirus disease 2019 pneumonia defined by diffuse ground-glass and consolidative opacities, predominantly involving the lower zone in both lungs.
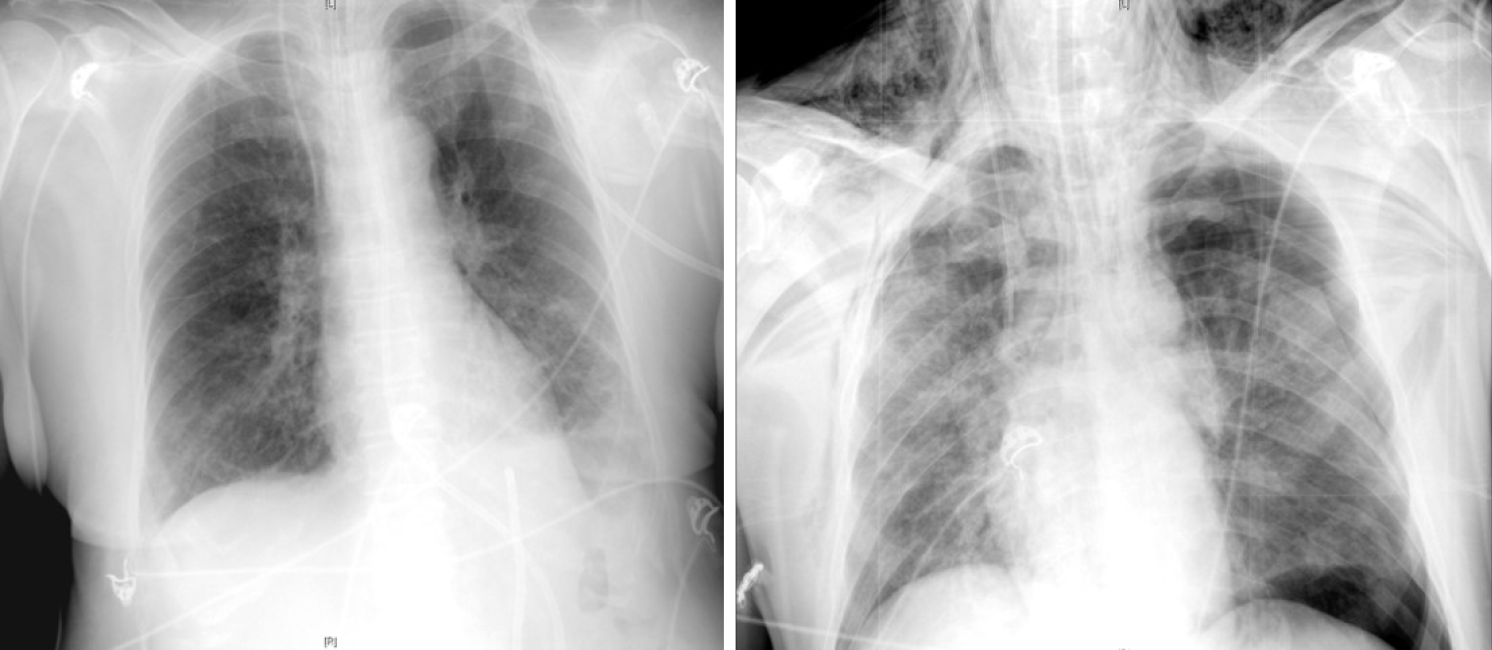
Figure 3 AP chest X-ray findings.
AP chest X-ray findings (left) in an 80-year-old man with bilateral COVID-19 pneumonia and associated left pleural effusion. AP chest X-ray findings (right) in an 84-year-old man with bilateral alveolar infiltrates, diffusely distributed and left tension pneumothorax with subcutaneous emphysema.
Figure 4 Images demonstrating the main changes in lung ultrasonography in coronavirus disease 2019 patients.
A: Normal A-pattern with presence of 1 B line. B: Normal pleural line with presence of > 3 B lines. C: Irregular pleural line with coalescent B lines. D: Pleural involvement as sign of poor areation.
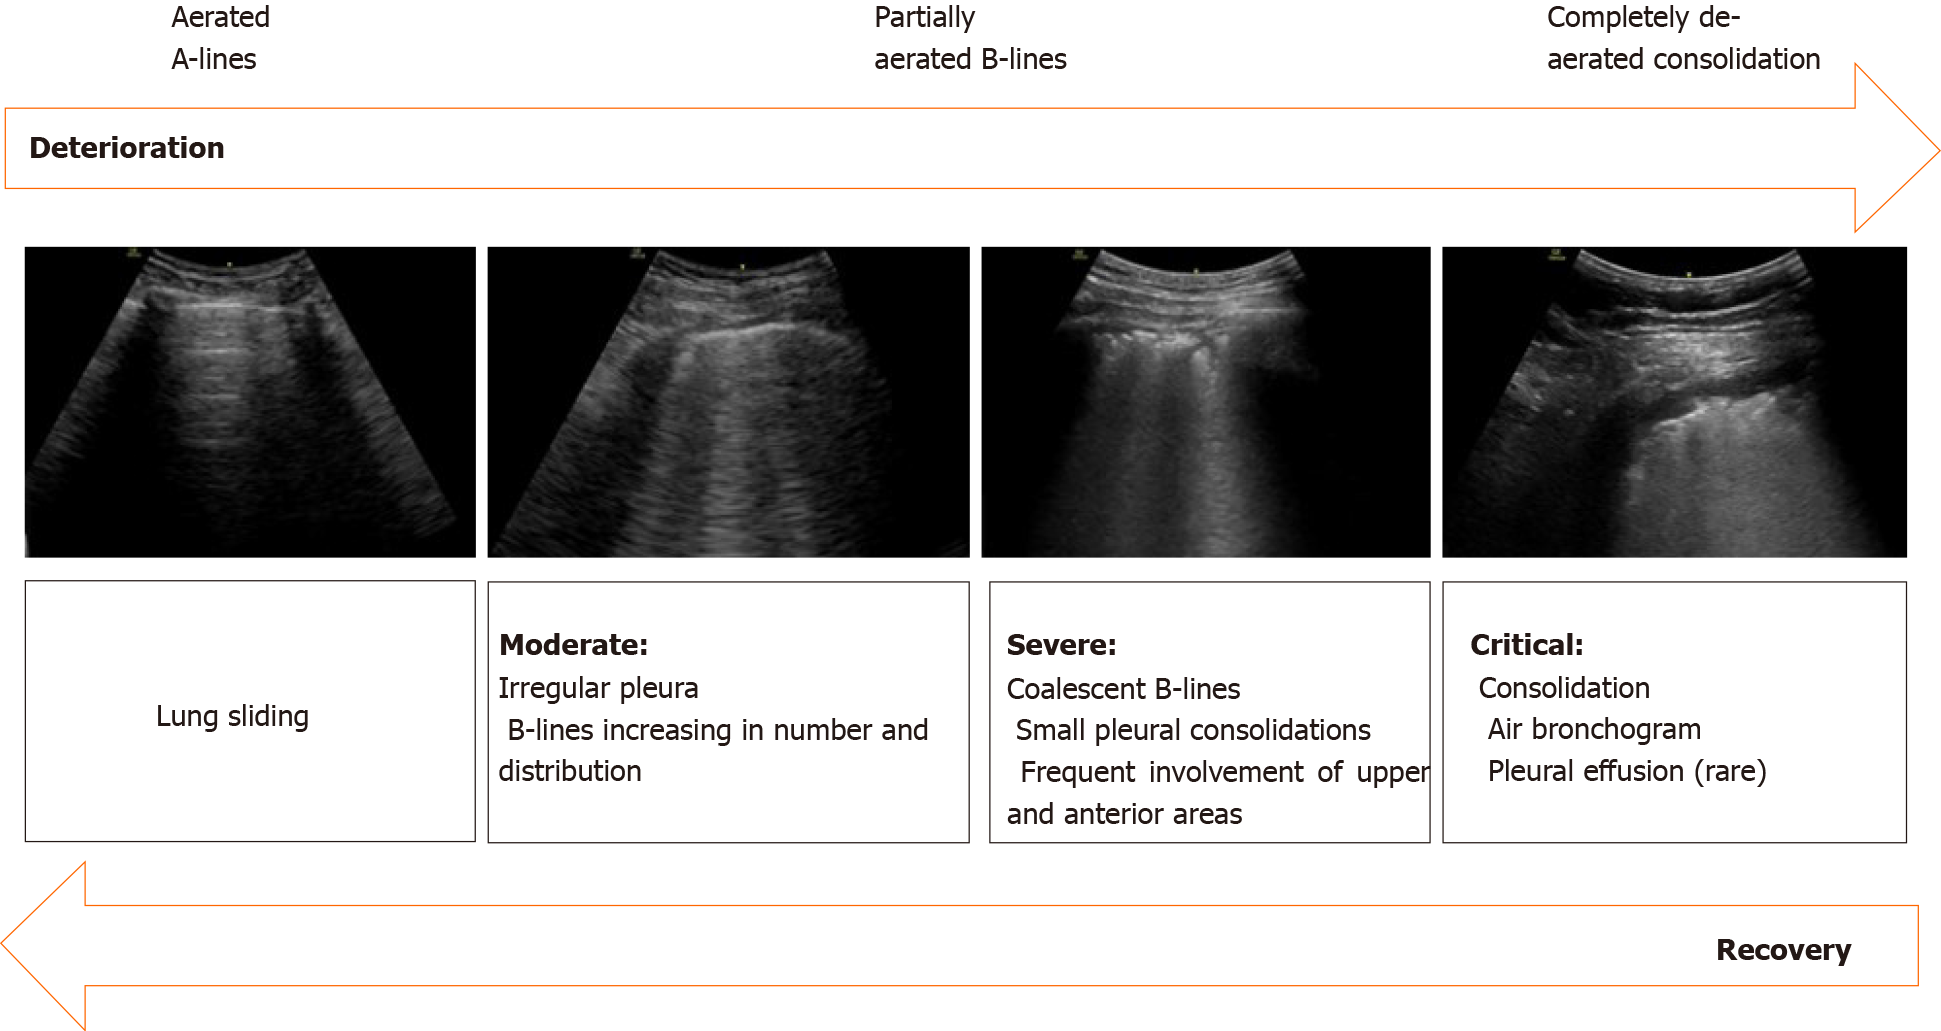
Figure 5
Sonographic characteristics of moderate, severe and critical pleural and parenchymal changes in patients with coronavirus disease 2019.
Figure 6 59-year-old man with no clinical background and confirmed severe acute respiratory syndrome coronavirus-2 infection.
Chest computed tomography imaging with peripherally distributed bilateral and multilobar ground-glass opacities.
Figure 7 45-year-old woman with coronavirus disease 2019-confirmed pneumonia.
Chest computed tomography imaging. A: Bilateral and patchy ground-glass opacities involving upper and lower lobes. B: Crazy paving pattern involving upper and lower lobes. C: Alveolar consolidation mainly involving the lower lobes, with fibrous stripes associated.
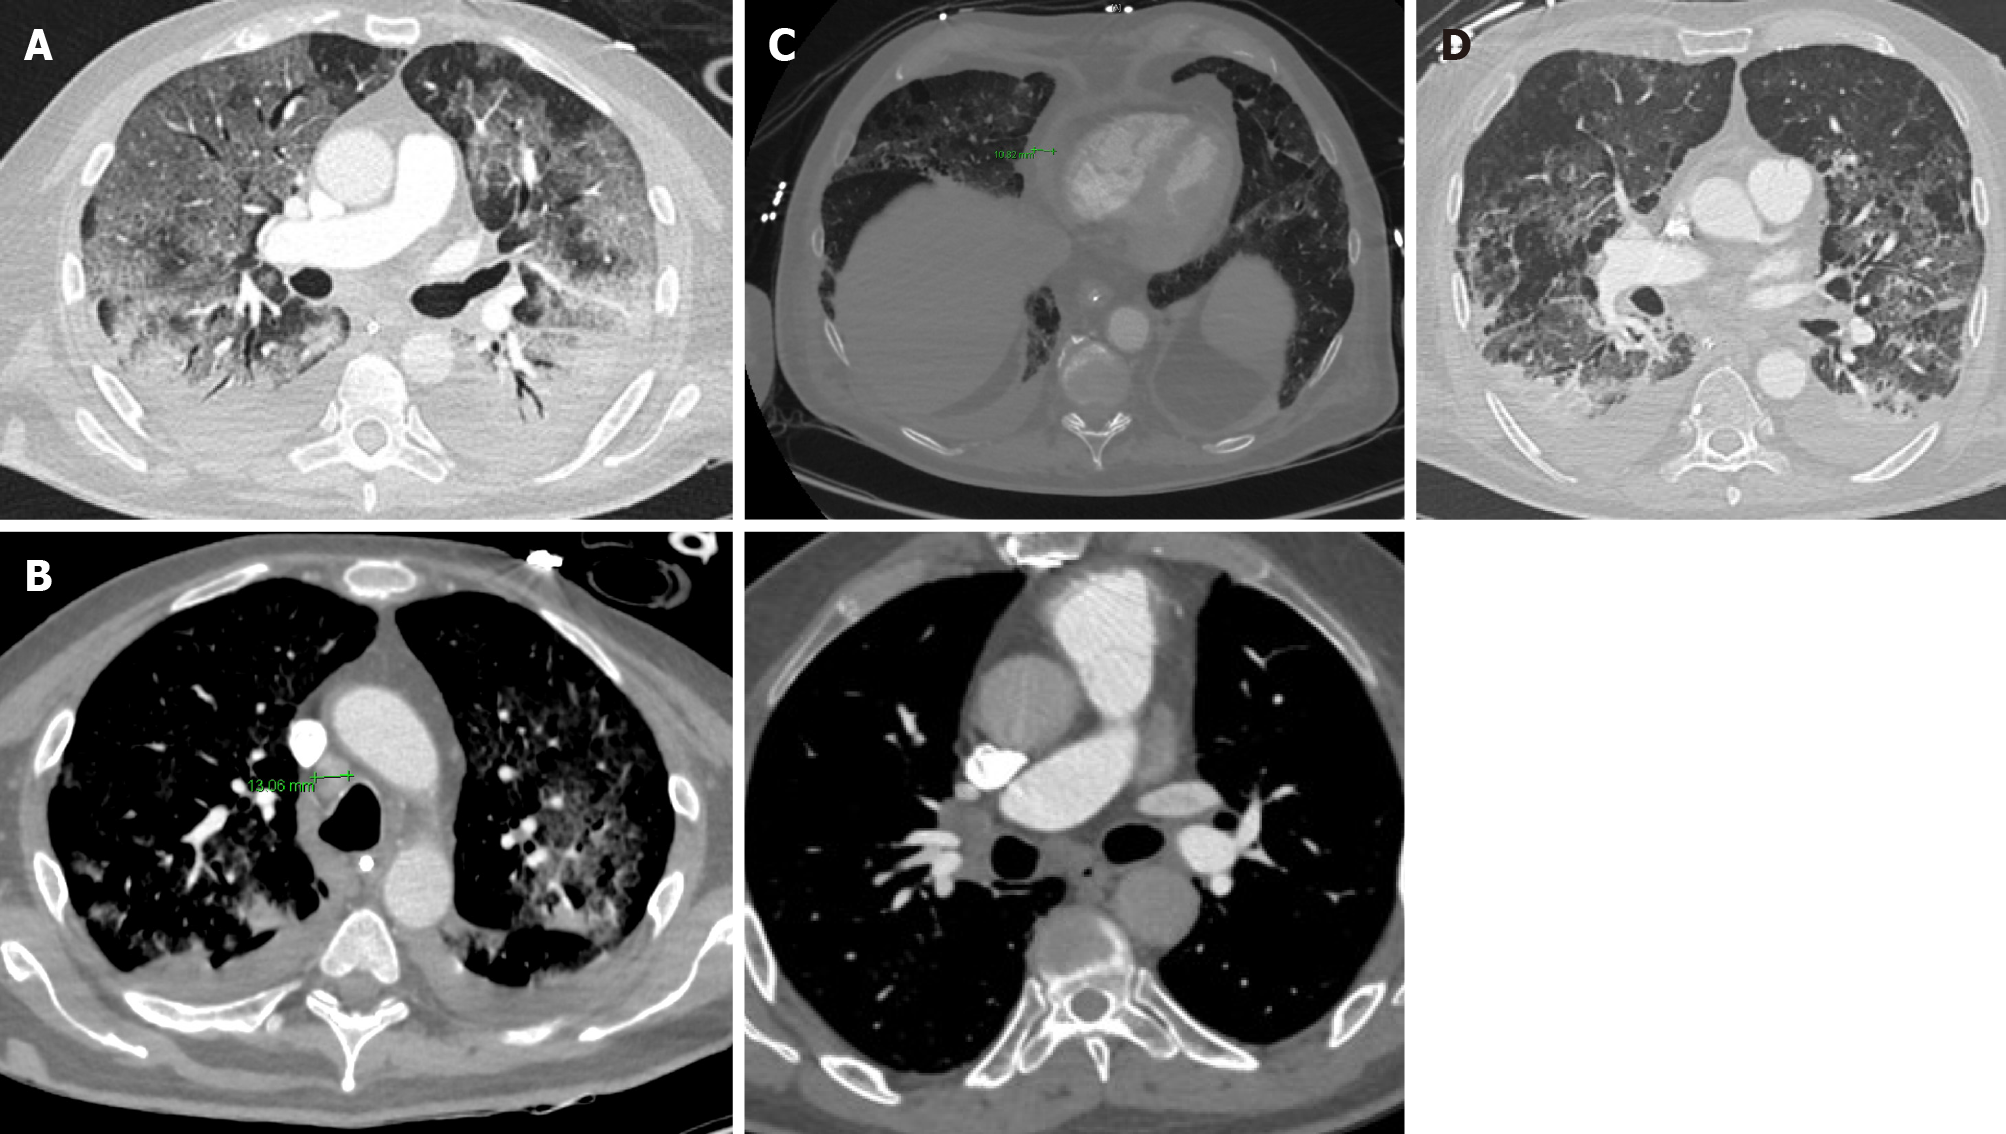
Figure 8 Unusual chest computed tomography findings in coronavirus disease 2019 pneumonia.
A: Air bronchogram sign; B: Right paratracheal lymphadenopathy (marked) and right hilar lymphadenopathy; C: Pericardial effusion; D: Pleural effusion.
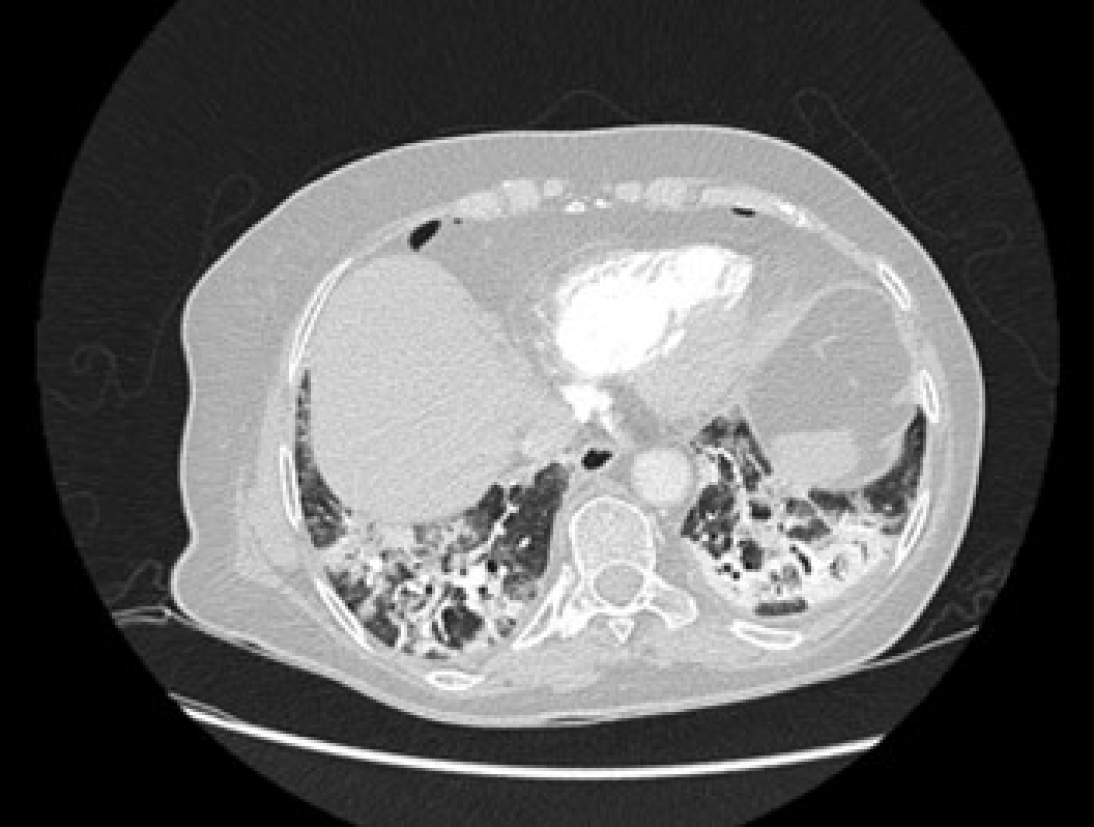
Figure 9
Reticular pattern and fibrous stripes showing coronavirus disease 2019 pneumonia in evolution (> 2 wk after the onset of symptoms).
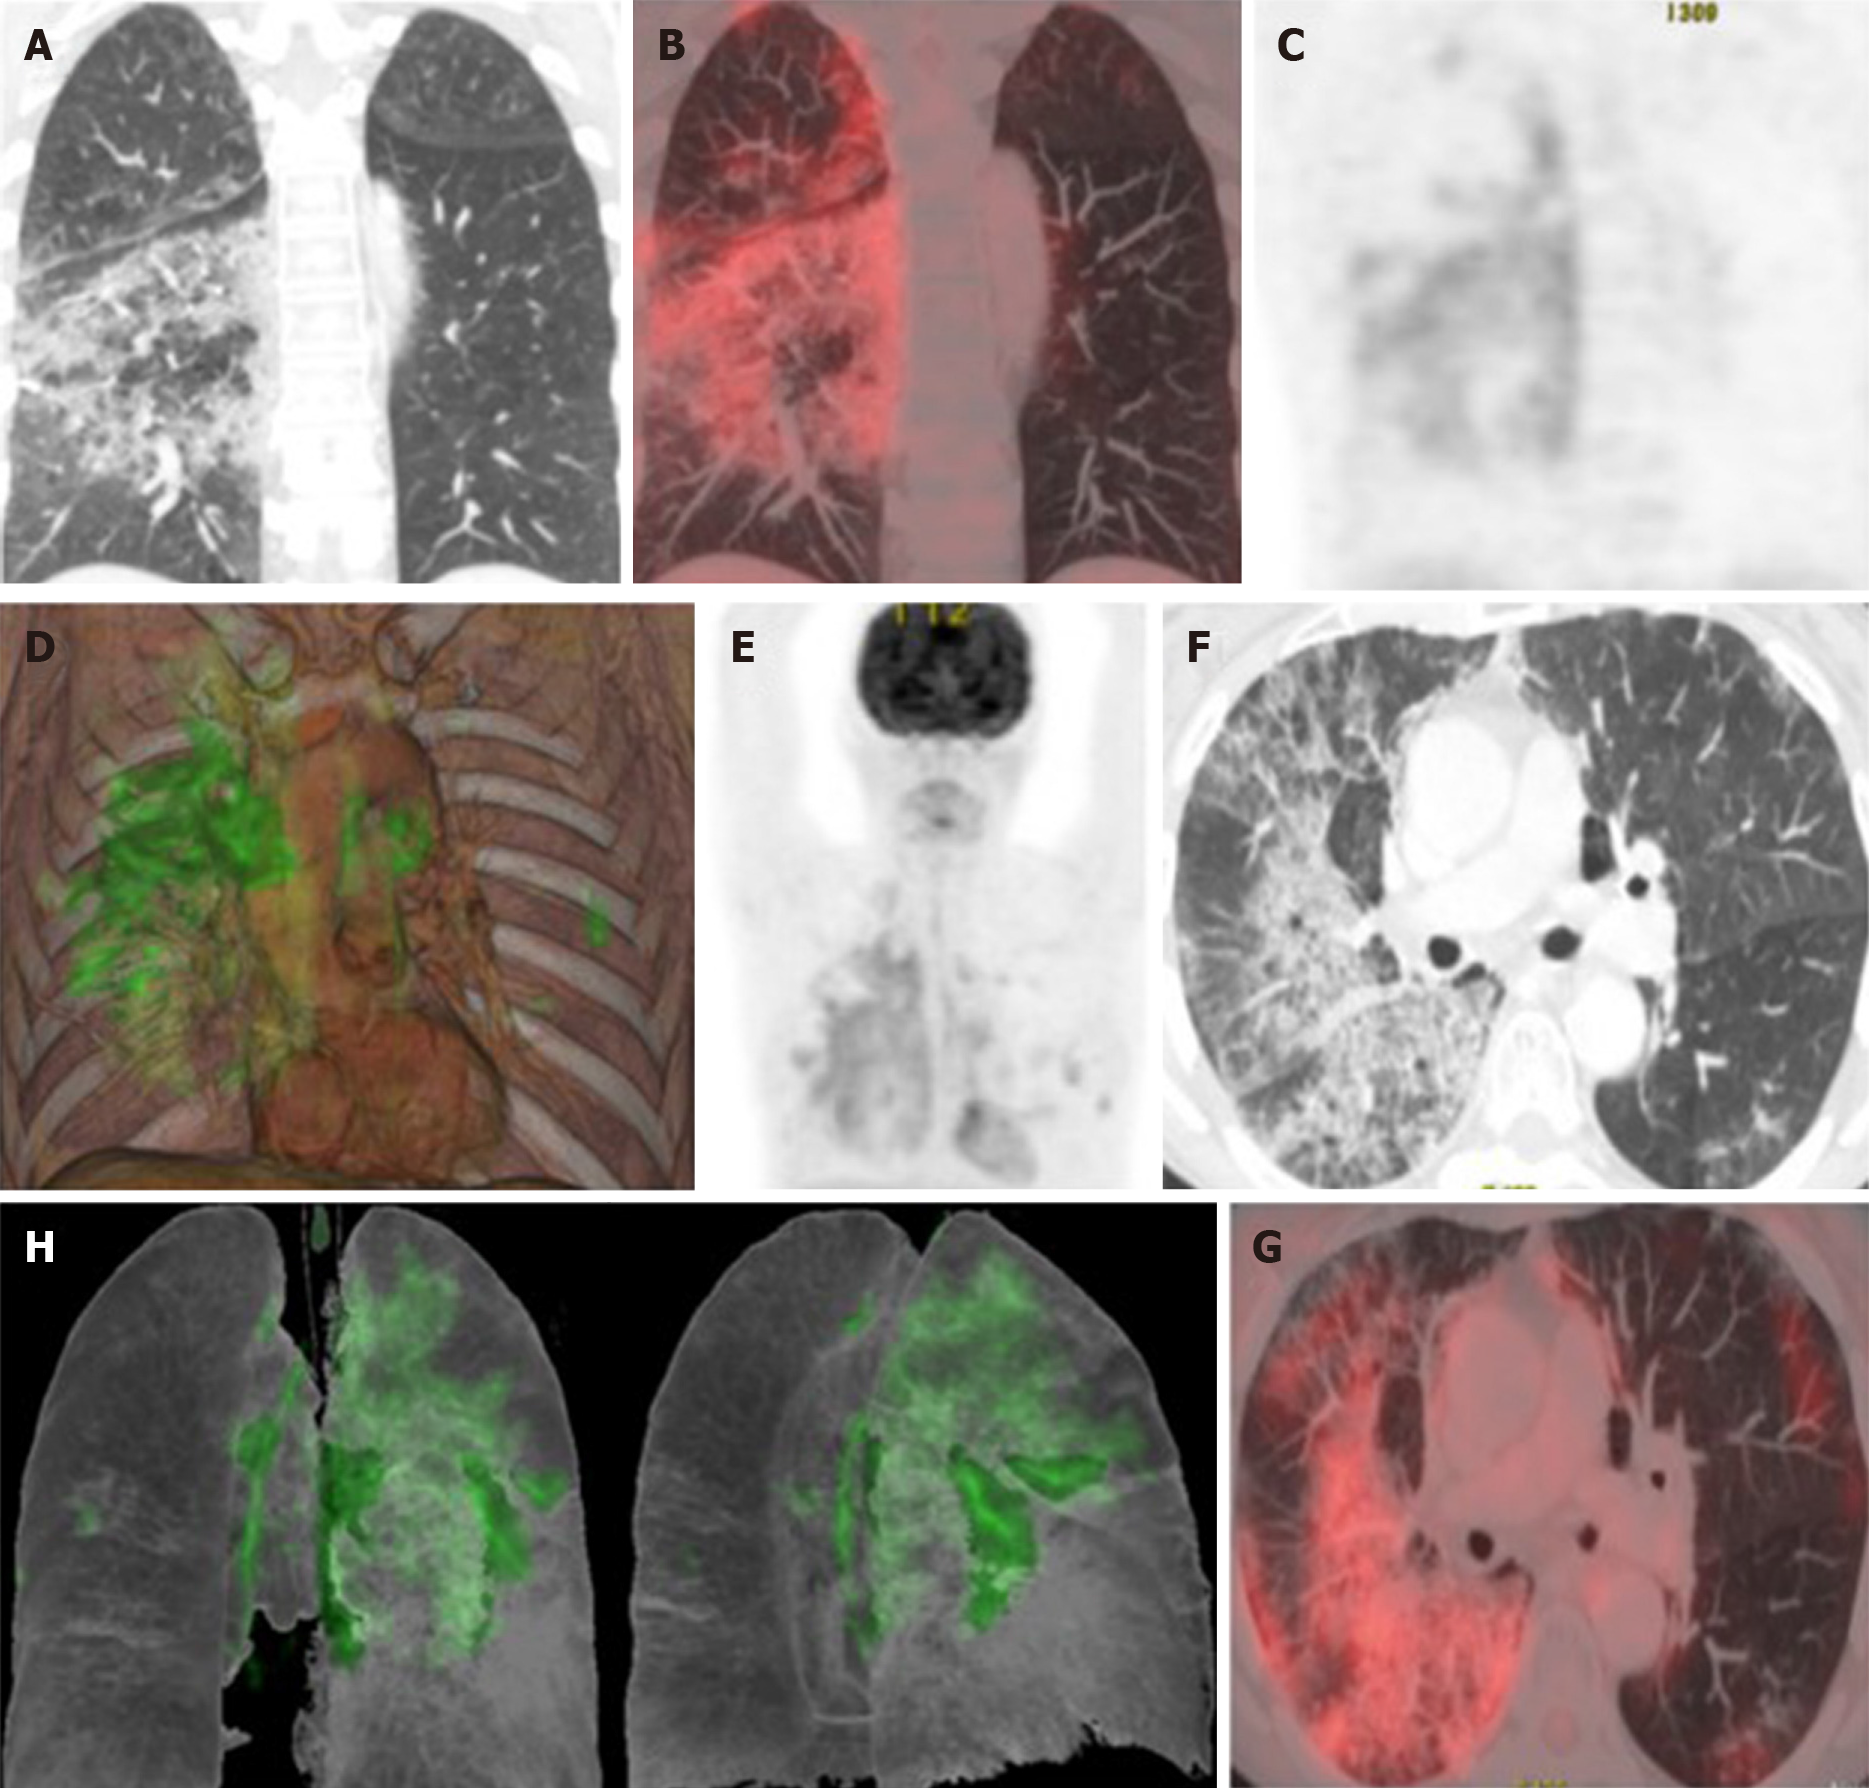
Figure 10 Taken from Landete et al[12], A 65-year-old patient with a history of invasive lepidic-predominant adenocarcinoma (stage pT1bNxM0) treated with surgery, chemotherapy and radiotherapy.
A: Coronal computed tomography (CT) showing the crazy paving pattern with a markedly asymmetric bilateral distribution, mainly affecting the right side. B: Positron emission tomography-CT (PET-CT) coronal section. C: Metabolic PET. D: Volume rendering 3D PET-CT. E: MIP, PET. Images B–E reveal an increased cellular activity [standard uptake value (SUV) 4-6] related to the associated inflammatory process and a PET-CT pattern of bilateral coronavirus disease 2019 (COVID-19) with viral pneumonitis, predominantly right-sided. F: Axial CT showing crazy paving pattern with a bilateral, yet markedly asymmetric distribution, predominant right-sided. G and H: Axial section and 3D volume rendering from PET-CT metabolic imaging revealing increased cellular activity (SUV 4-6) related to the associated inflammatory process. PET-CT pattern of bilateral, predominantly right-sided, COVID-19 viral pneumonitis. Citation: Landete P, Quezada Loaiza CA, Aldave-Orzaiz B, Muñiz SH, Maldonado A, Zamora E, Sam Cerna AC, Del Cerro E, Alonso RC, Couñago F. Clinical features and radiological manifestations of COVID-19 disease. World J Radiol 2020; 12(11): 247-260. Copyright ©The Author(s) 2020. Published by Baishideng Publishing Group Inc[12]”.
- Citation: Churruca M, Martínez-Besteiro E, Couñago F, Landete P. COVID-19 pneumonia: A review of typical radiological characteristics. World J Radiol 2021; 13(10): 327-343
- URL: https://www.wjgnet.com/1949-8470/full/v13/i10/327.htm
- DOI: https://dx.doi.org/10.4329/wjr.v13.i10.327


