Copyright
©The Author(s) 2015.
World J Cardiol. Aug 26, 2015; 7(8): 466-475
Published online Aug 26, 2015. doi: 10.4330/wjc.v7.i8.466
Published online Aug 26, 2015. doi: 10.4330/wjc.v7.i8.466
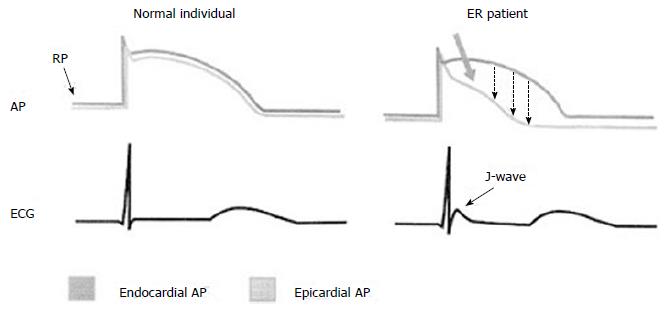
Figure 2 Schematic representation of the possible mechanisms underlying J-wave occurrence.
Action potentials from epicardium and endocardium from normal individuals (left) and early repolarization (ER) patients (right) as well as the respective electrocardiograms are shown. A prominent phase I-notch and the loss of epicardial dome in phase - 2 (thick arrow) results in transmural dispersion of repolarization (dashed arrows) and appearance of the J-wave and ST-segment elevation on the surface ECG. AP: Action potential; ECG: Electrocardiogram; ER: Early repolarization; RP: Resting potention. Reproduced with permission, from ref.[67].
- Citation: Ali A, Butt N, Sheikh AS. Early repolarization syndrome: A cause of sudden cardiac death. World J Cardiol 2015; 7(8): 466-475
- URL: https://www.wjgnet.com/1949-8462/full/v7/i8/466.htm
- DOI: https://dx.doi.org/10.4330/wjc.v7.i8.466


