
















Copyright: ©Author(s) 2026.
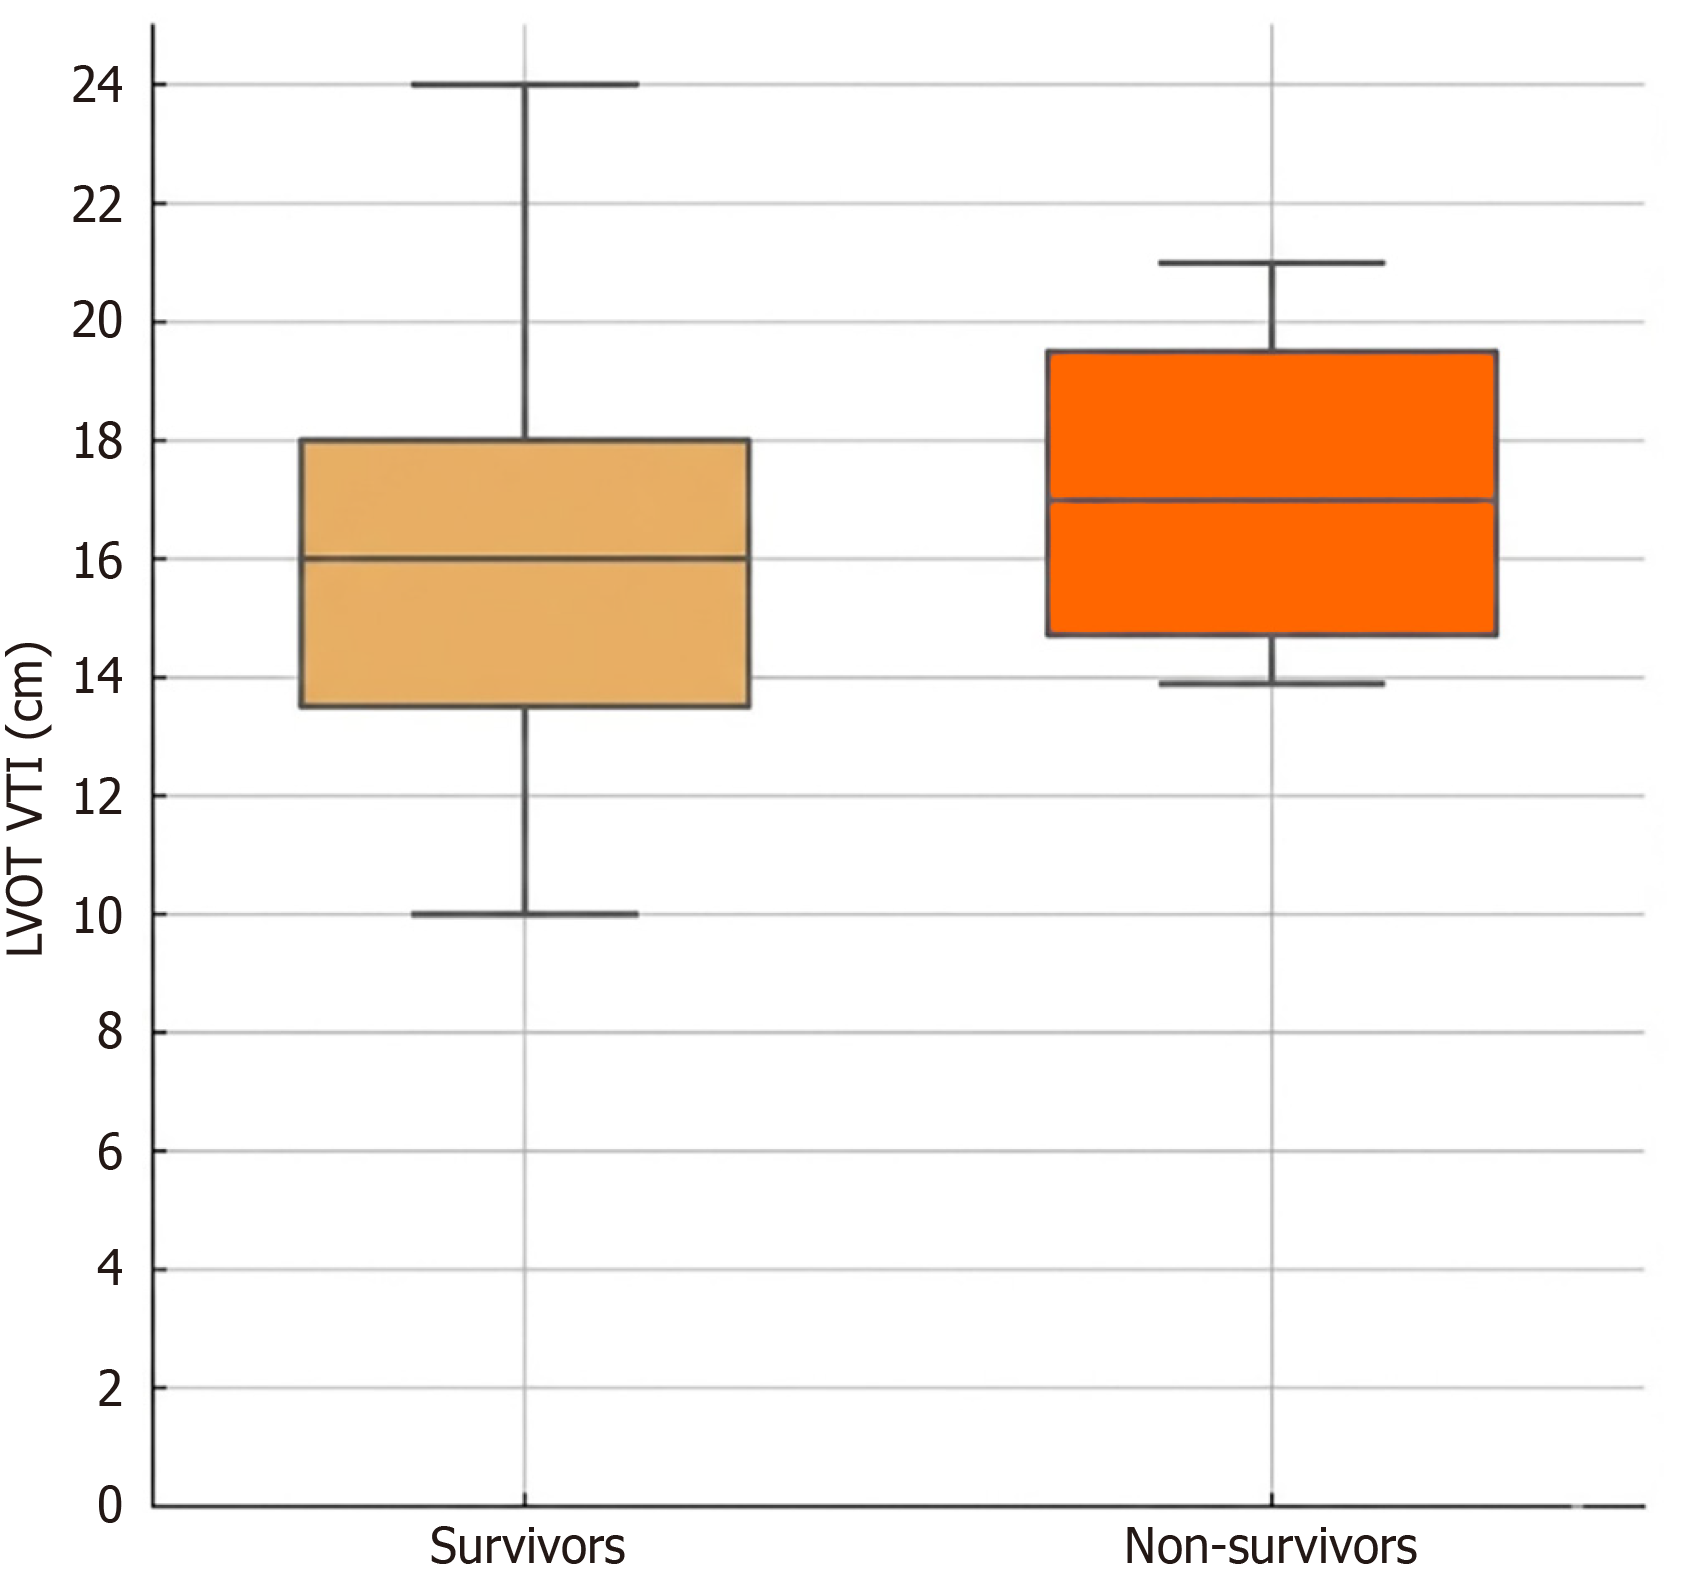
Figure 3 Distribution of left ventricular outflow tract velocity-time integral according to in-hospital mortality.
LVOT: Left ventricular outflow tract; VTI: Velocity-time integral. The authors used ChatGPT (version GPT-5.1, OpenAI, San Francisco, CA, United States) to assist in generating the graphical representations of the study data included in Figure 3. All AI-assisted graphical content was reviewed, verified, and approved by the authors, who take full responsibility for the accuracy, originality, and integrity of the final figures.
- Citation: Popescu DC, Diaconu M, Țînț D, Nechita AC. Left and right ventricular echocardiographic patterns in cardiogenic pulmonary edema: An exploratory retrospective study. World J Cardiol 2026; 18(7): 121228
- URL: https://www.wjgnet.com/1949-8462/full/v18/i7/121228.htm
- DOI: https://dx.doi.org/10.4330/wjc.121228