
















©The Author(s) 2025.
World J Cardiol. Nov 26, 2025; 17(11): 109739
Published online Nov 26, 2025. doi: 10.4330/wjc.v17.i11.109739
Published online Nov 26, 2025. doi: 10.4330/wjc.v17.i11.109739
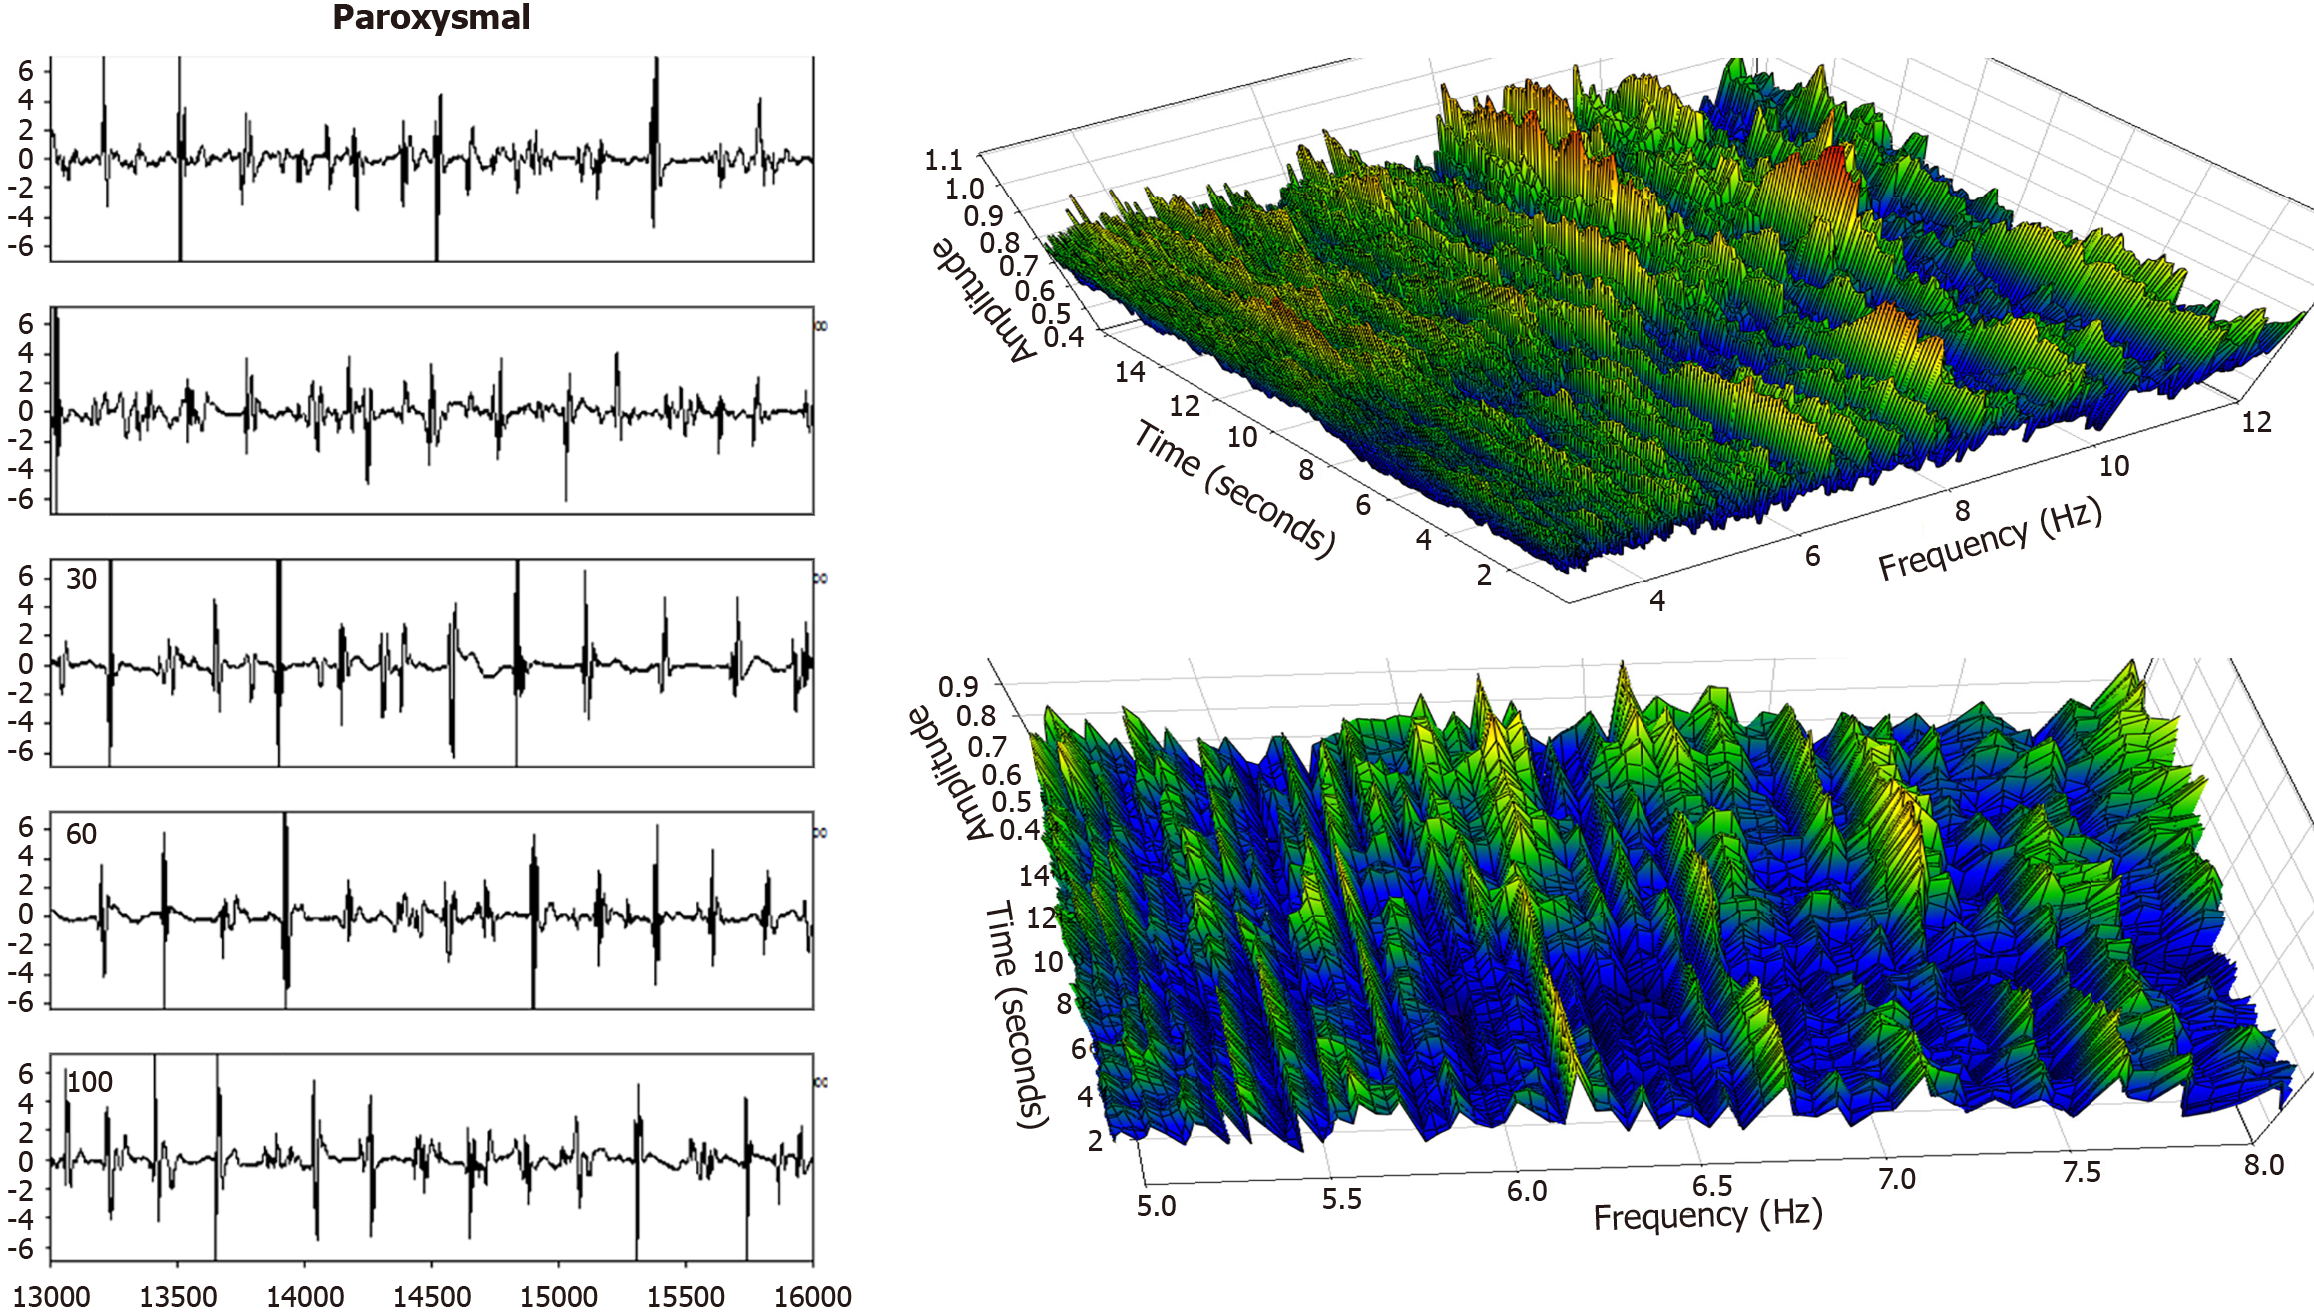
Figure 8 In this bipolar signal recording from the same paroxysmal atrial fibrillation patient, posterior free wall, there are longer isoelectric intervals between time series activation deflections (left panel) with irregular morphology.
Yet, this substrate may be more organized in the sense of activating more or less simultaneously, though it is less organized in the sense of variability in the deflection morphology and timing of each of these activation events. Overall, it results in the frequency spectrum (right panels) being composed of mostly low-power areas, and very little constancy in the dominant frequency (use of clinical data and its analysis for construction of the Figures 1, 2, 3, 4, 5, 6, 7 and 8 contained herein was approved by the Institutional Review Board of Columbia University Irving Medical Center).
- Citation: Ciaccio EJ, Hsia HH, Yarmohammadi H, Wan EY, Peters NS, Saluja D, Biviano AB. Atrial fibrillation substrate mapping with emphasis on voltage-based guidance. World J Cardiol 2025; 17(11): 109739
- URL: https://www.wjgnet.com/1949-8462/full/v17/i11/109739.htm
- DOI: https://dx.doi.org/10.4330/wjc.v17.i11.109739