
















©The Author(s) 2025.
World J Cardiol. Nov 26, 2025; 17(11): 109739
Published online Nov 26, 2025. doi: 10.4330/wjc.v17.i11.109739
Published online Nov 26, 2025. doi: 10.4330/wjc.v17.i11.109739
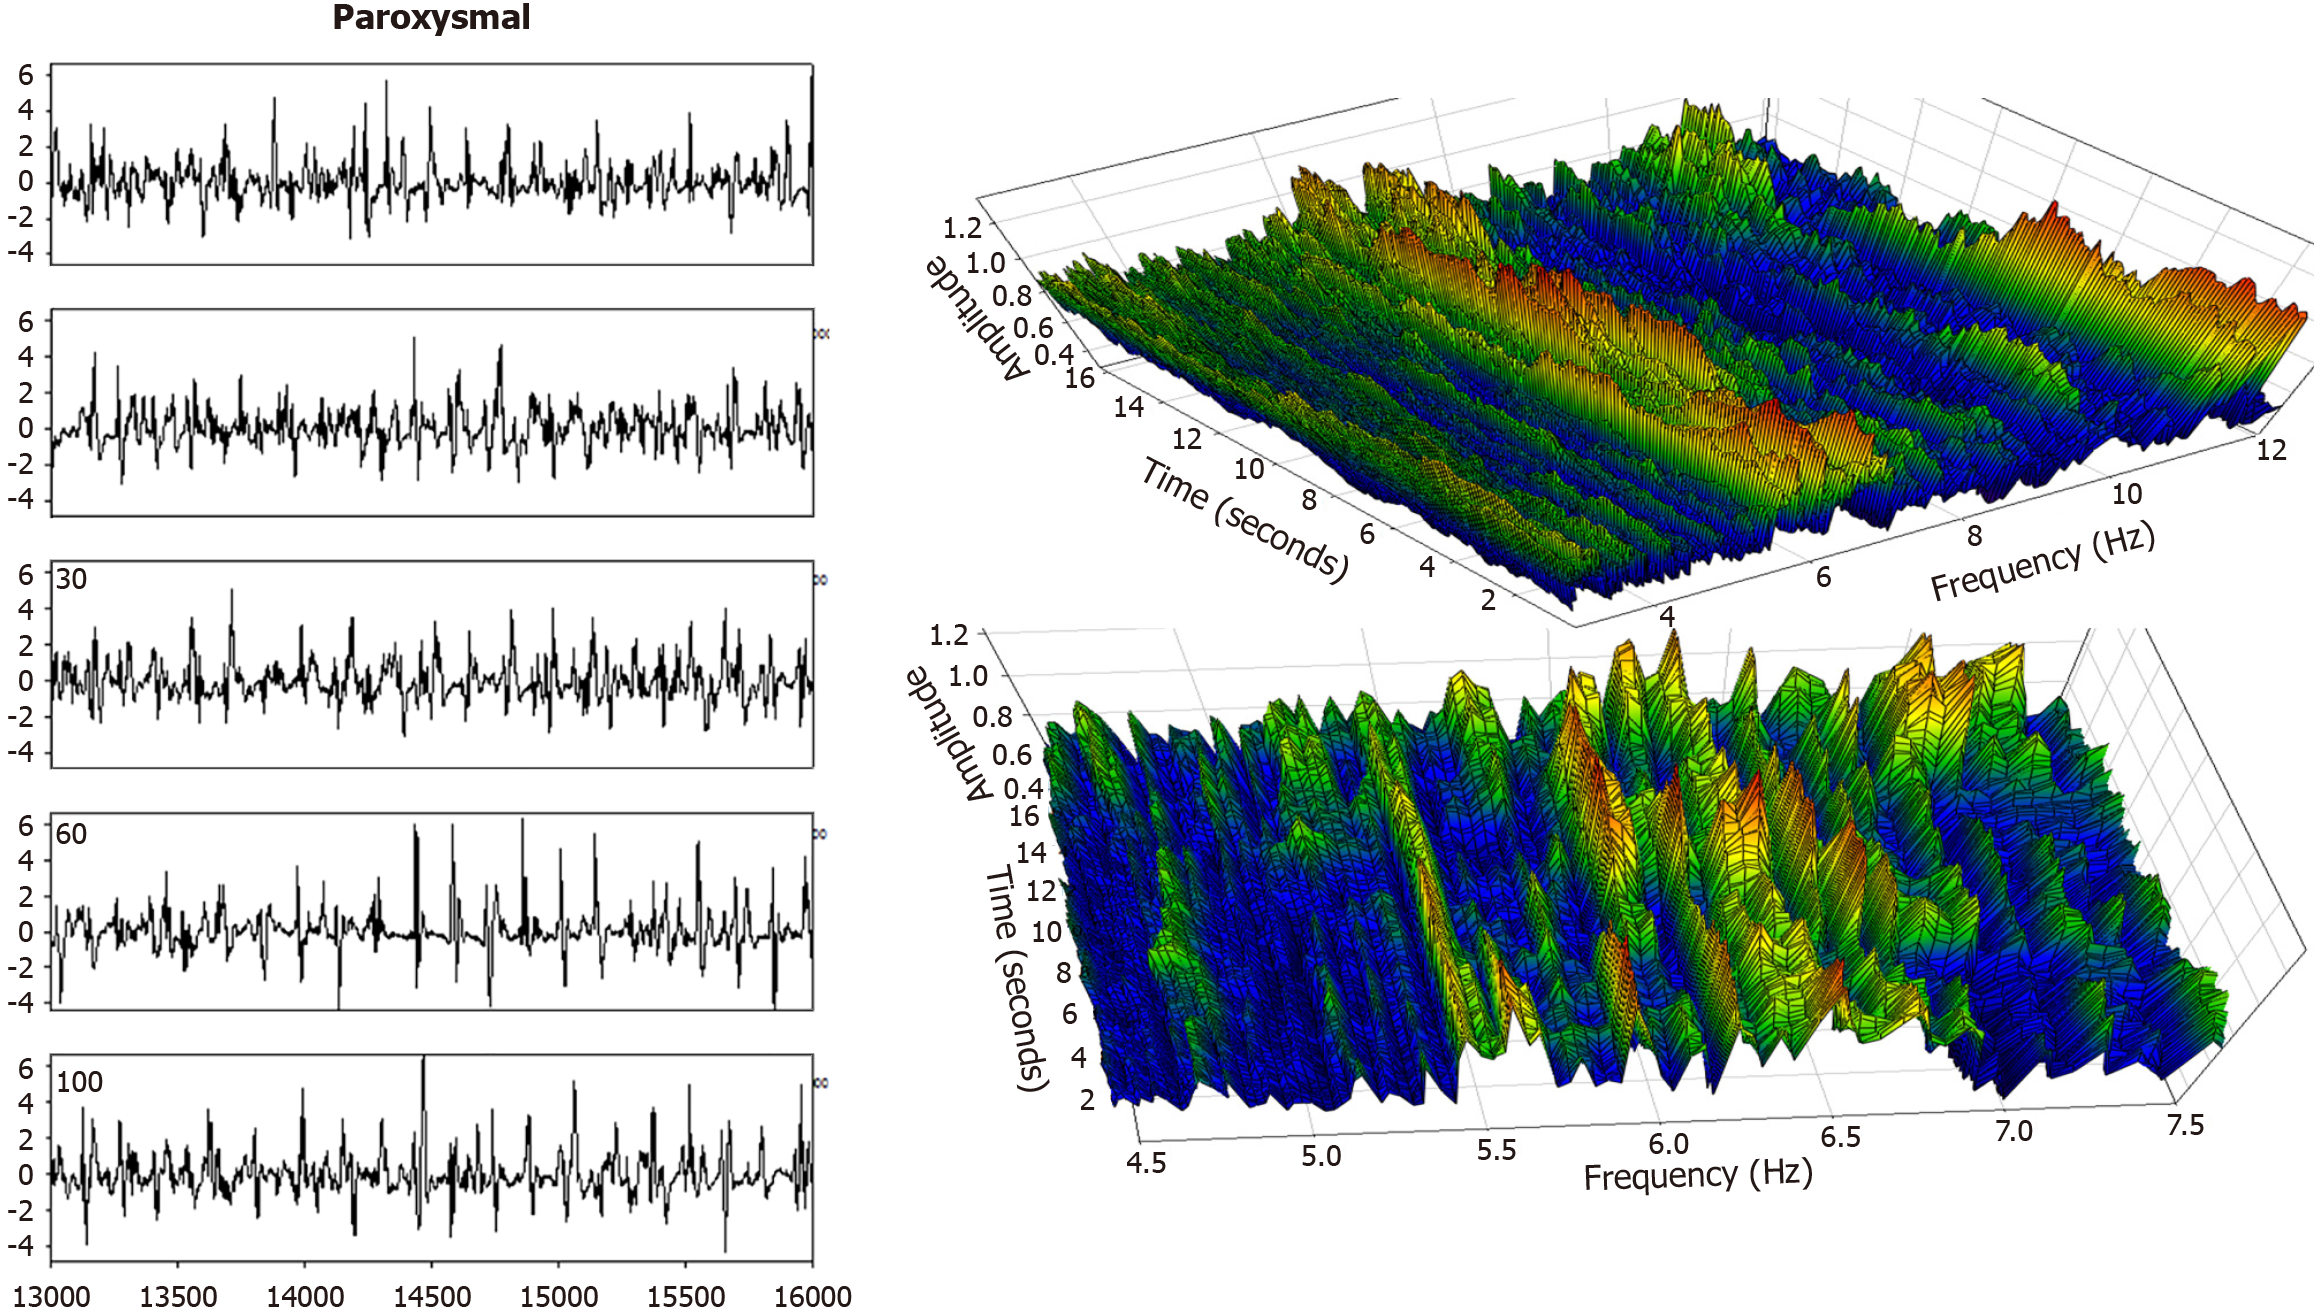
Figure 7 Paroxysmal atrial fibrillation patient data.
To the left is the sequence of successive intervals from a left atrial recording during atrial fibrillation, anterior free wall. The deflections appear to be more randomized (variable deflection shape, duration, and interval between deflections), as compared with those from the persistent AF patient, Figures 5 and 6. Indeed, a more randomized frequency spectrum is evident in the right panels. The dominant frequency (DF) in this case ranges from about 6–6.5 Hz. Thus, it is fluctuating in frequency over time. Furthermore, the DF magnitude or amplitude is quite variable even over short time intervals, particularly evident in the zoom-in lower frequency graph.
- Citation: Ciaccio EJ, Hsia HH, Yarmohammadi H, Wan EY, Peters NS, Saluja D, Biviano AB. Atrial fibrillation substrate mapping with emphasis on voltage-based guidance. World J Cardiol 2025; 17(11): 109739
- URL: https://www.wjgnet.com/1949-8462/full/v17/i11/109739.htm
- DOI: https://dx.doi.org/10.4330/wjc.v17.i11.109739