
















©The Author(s) 2025.
World J Cardiol. Nov 26, 2025; 17(11): 109739
Published online Nov 26, 2025. doi: 10.4330/wjc.v17.i11.109739
Published online Nov 26, 2025. doi: 10.4330/wjc.v17.i11.109739
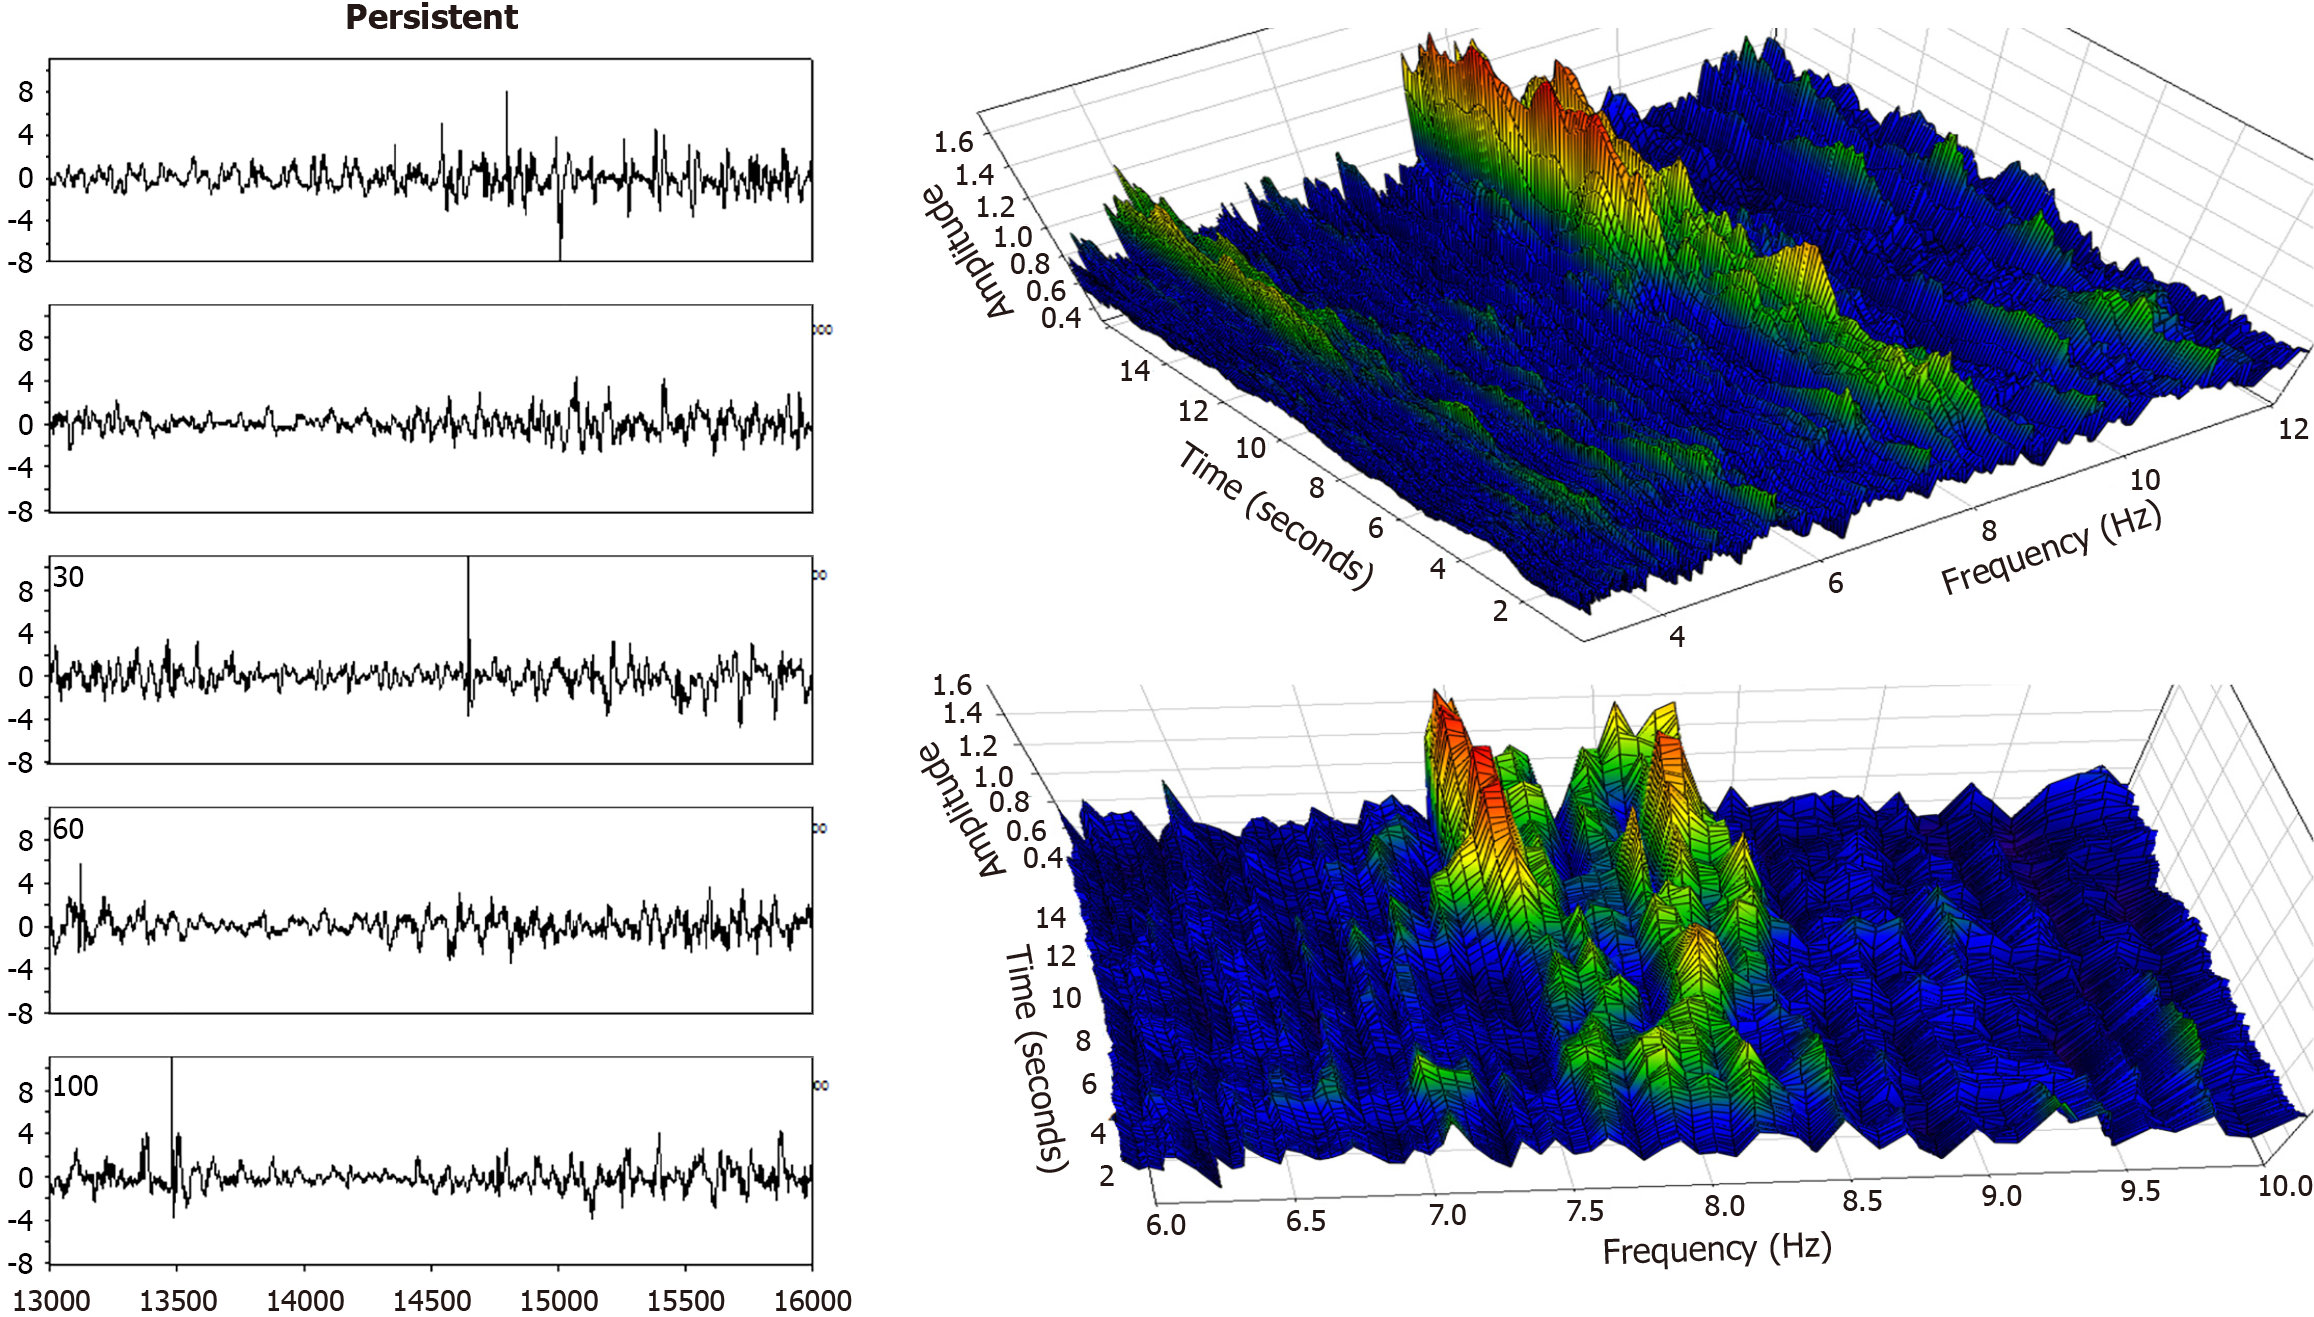
Figure 6 Left panel: An atrial fibrillation electrogram, posterior free wall, taken from the same persistent atrial fibrillation patient as in Figure 5.
Here the signal amplitude is more vacillating (left panel) vs Figure 5, and this translates into a more changeable spectral magnitude (maximum amplitude or color, right panels). As is evident in the lower frequency graph, there is less organization at signal onset (first 8 seconds) with only a low power dominant frequency (green and some yellow color above the blue background). During the latter half of the interval, however, two apparently competing dominant frequencies arise and form large spectral components (red and orange colors).
- Citation: Ciaccio EJ, Hsia HH, Yarmohammadi H, Wan EY, Peters NS, Saluja D, Biviano AB. Atrial fibrillation substrate mapping with emphasis on voltage-based guidance. World J Cardiol 2025; 17(11): 109739
- URL: https://www.wjgnet.com/1949-8462/full/v17/i11/109739.htm
- DOI: https://dx.doi.org/10.4330/wjc.v17.i11.109739