Copyright
©The Author(s) 2021.
World J Cardiol. Jul 26, 2021; 13(7): 230-236
Published online Jul 26, 2021. doi: 10.4330/wjc.v13.i7.230
Published online Jul 26, 2021. doi: 10.4330/wjc.v13.i7.230
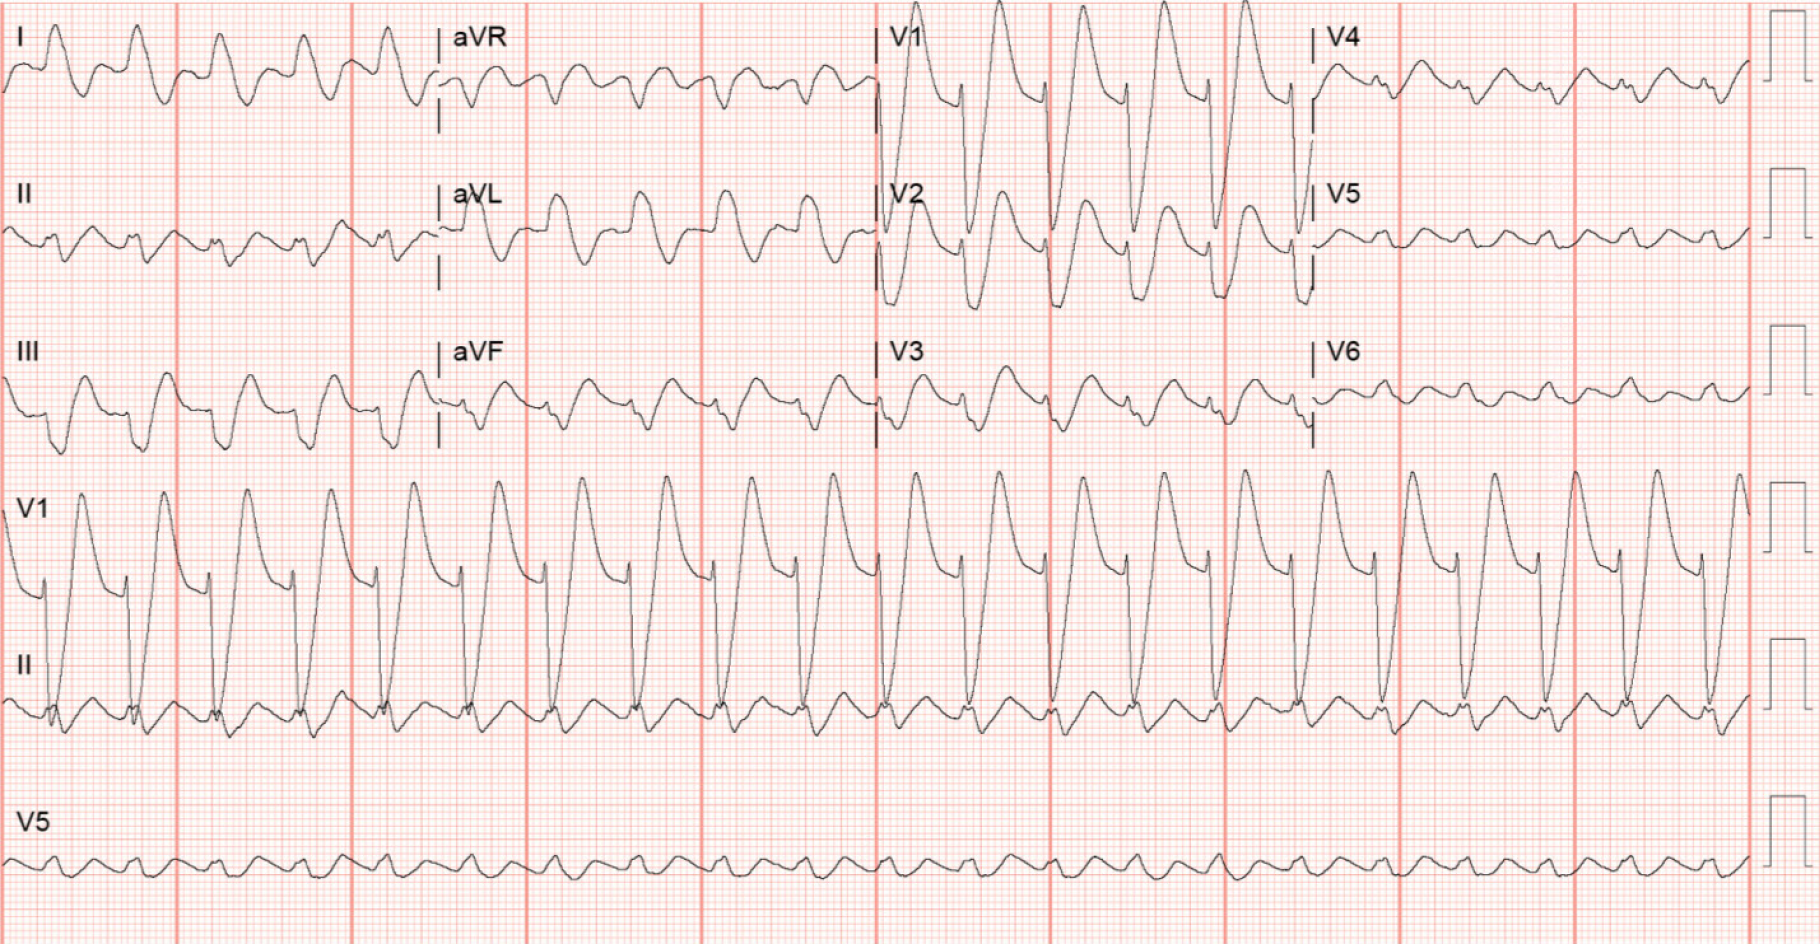
Figure 3 Electrocardiogram after resuscitation.
Twelve lead electrocardiogram showing classic description of hyperkalemic manifestations, peaked T waves in V1, V2, widened QRS complexes, P waves not seen and sine waves in V4, V5, V6.
- Citation: Soe KK, Seto AH. Sliding with the sines − fatal hyperkalemia: A case report. World J Cardiol 2021; 13(7): 230-236
- URL: https://www.wjgnet.com/1949-8462/full/v13/i7/230.htm
- DOI: https://dx.doi.org/10.4330/wjc.v13.i7.230


