Copyright
©The Author(s) 2020.
World J Cardiol. Sep 26, 2020; 12(9): 437-449
Published online Sep 26, 2020. doi: 10.4330/wjc.v12.i9.437
Published online Sep 26, 2020. doi: 10.4330/wjc.v12.i9.437
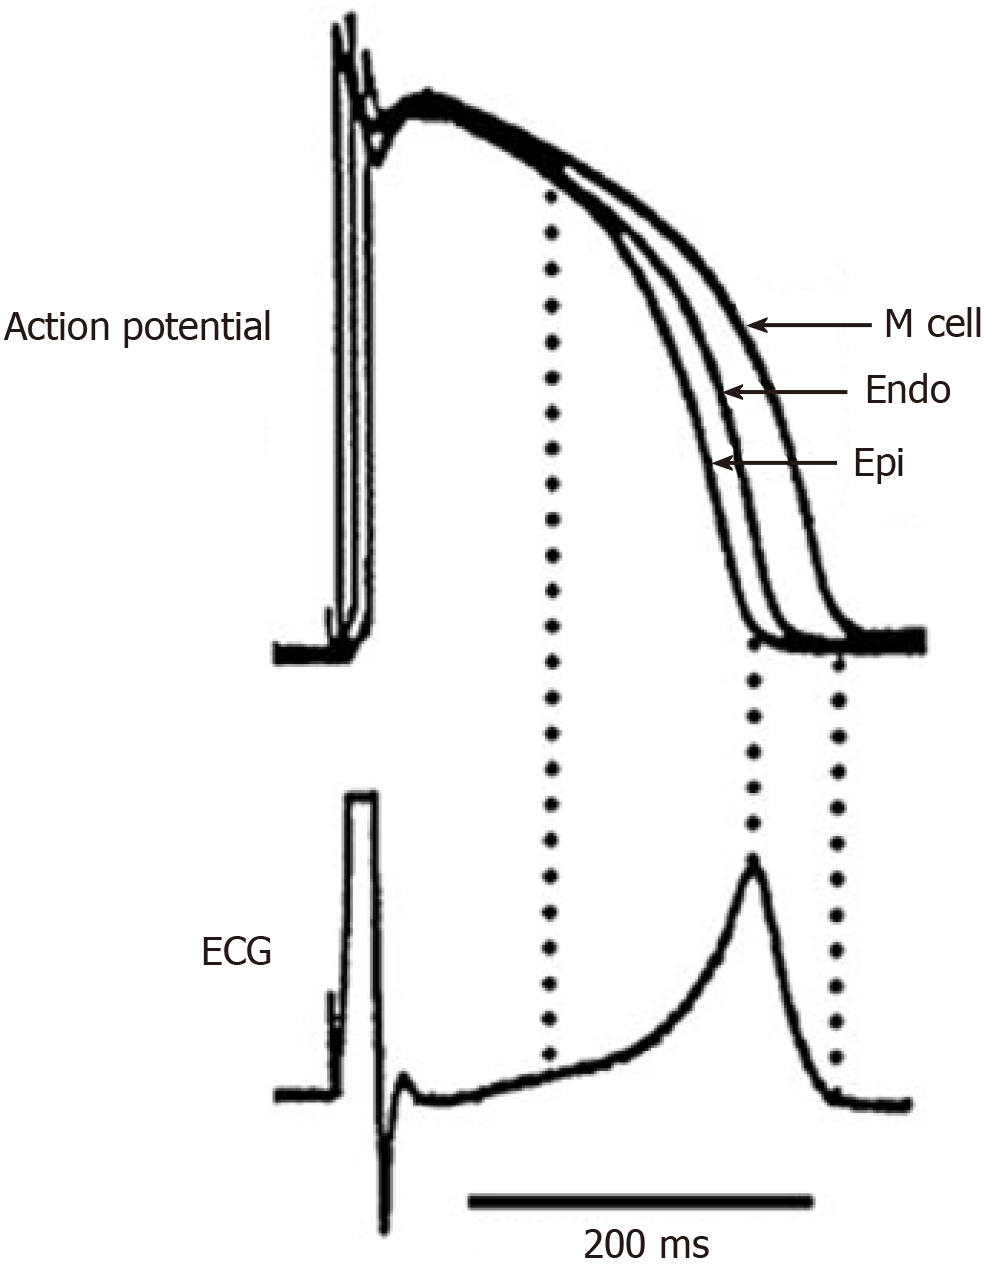
Figure 1 Transmembrane action potential and pseudo electrocardiogram recordings from a canine arterially perfused ventricular wedge preparation reveal the cellular basis for the T wave.
Top: Action potentials simultaneously recorded from endocardial, epicardial, and M region sites; Bottom: Electrocardiogram recorded across the wedge; the peak and the end of T-wave correspond to the end-of-repolarization of epicardial and M-cells, correspondingly. Compiled from Figure 2[8]. ECG: Electrocardiogram.
- Citation: Arteyeva NV. Dispersion of ventricular repolarization: Temporal and spatial. World J Cardiol 2020; 12(9): 437-449
- URL: https://www.wjgnet.com/1949-8462/full/v12/i9/437.htm
- DOI: https://dx.doi.org/10.4330/wjc.v12.i9.437


