Copyright
©2010 Baishideng Publishing Group Co.
World J Cardiol. Jul 26, 2010; 2(7): 205-210
Published online Jul 26, 2010. doi: 10.4330/wjc.v2.i7.205
Published online Jul 26, 2010. doi: 10.4330/wjc.v2.i7.205
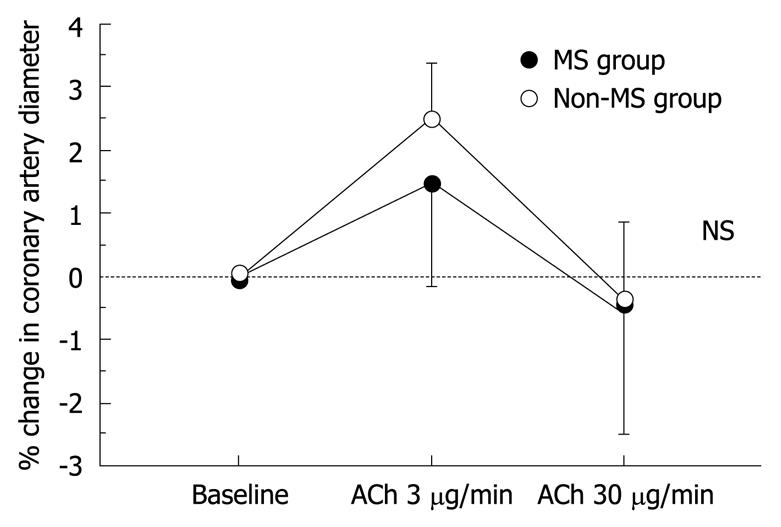
Figure 1 Percentage changes in epicardial coronary artery diameter in response to acetylcholine infusion.
The changes in coronary artery diameter in response to acetylcholine infusion were similar between patients with metabolic syndrome (MS; solid circles) and patients without MS (open circles). Vertical bars represent SE. NS: Not significant.
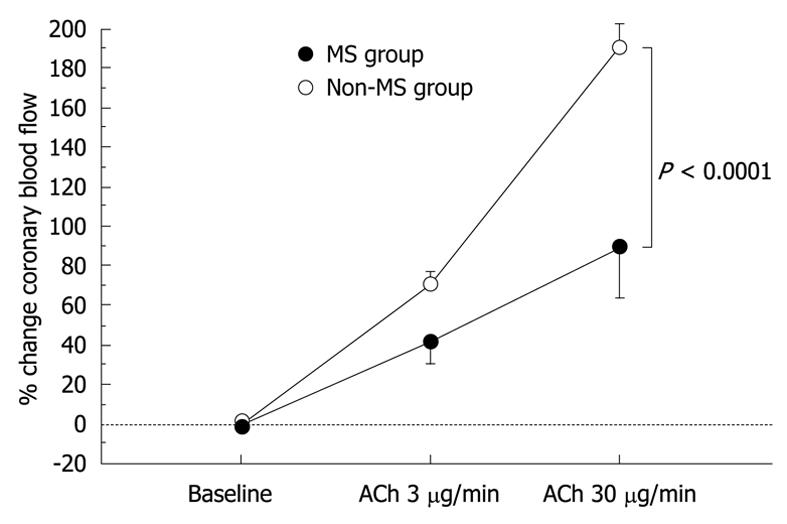
Figure 2 Percentage changes in coronary blood flow in response to acetylcholine infusion.
The increase in coronary blood flow in response to acetylcholine infusion was attenuated in metabolic syndrome (MS) patients (solid circles) relative to non-MS patients (open circles). Vertical bars represent SE.
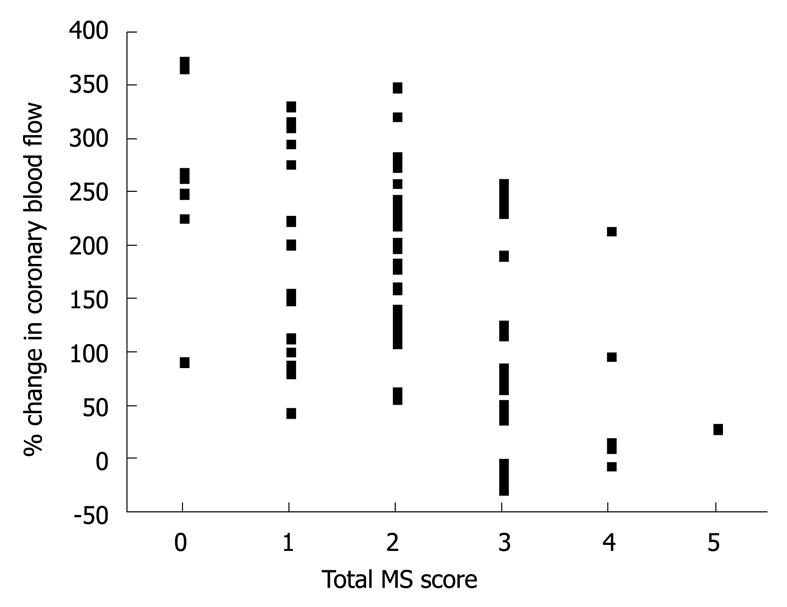
Figure 3 Relationship between the change in coronary blood flow induced by acetylcholine at 30 μg/min and the total metabolic syndrome score.
The total metabolic syndrome score was inversely associated with the change in coronary blood flow induced by acetylcholine infusion at 30 μg/min (r = -0.51, P < 0.0001). MS: Metabolic syndrome.
- Citation: Teragawa H, Mitsuba N, Nishioka K, Ueda K, Kono S, Higashi Y, Chayama K, Kihara Y. Impaired coronary microvascular endothelial function in men with metabolic syndrome. World J Cardiol 2010; 2(7): 205-210
- URL: https://www.wjgnet.com/1949-8462/full/v2/i7/205.htm
- DOI: https://dx.doi.org/10.4330/wjc.v2.i7.205


