Copyright
©The Author(s) 2021.
World J Cardiol. Dec 26, 2021; 13(12): 745-757
Published online Dec 26, 2021. doi: 10.4330/wjc.v13.i12.745
Published online Dec 26, 2021. doi: 10.4330/wjc.v13.i12.745
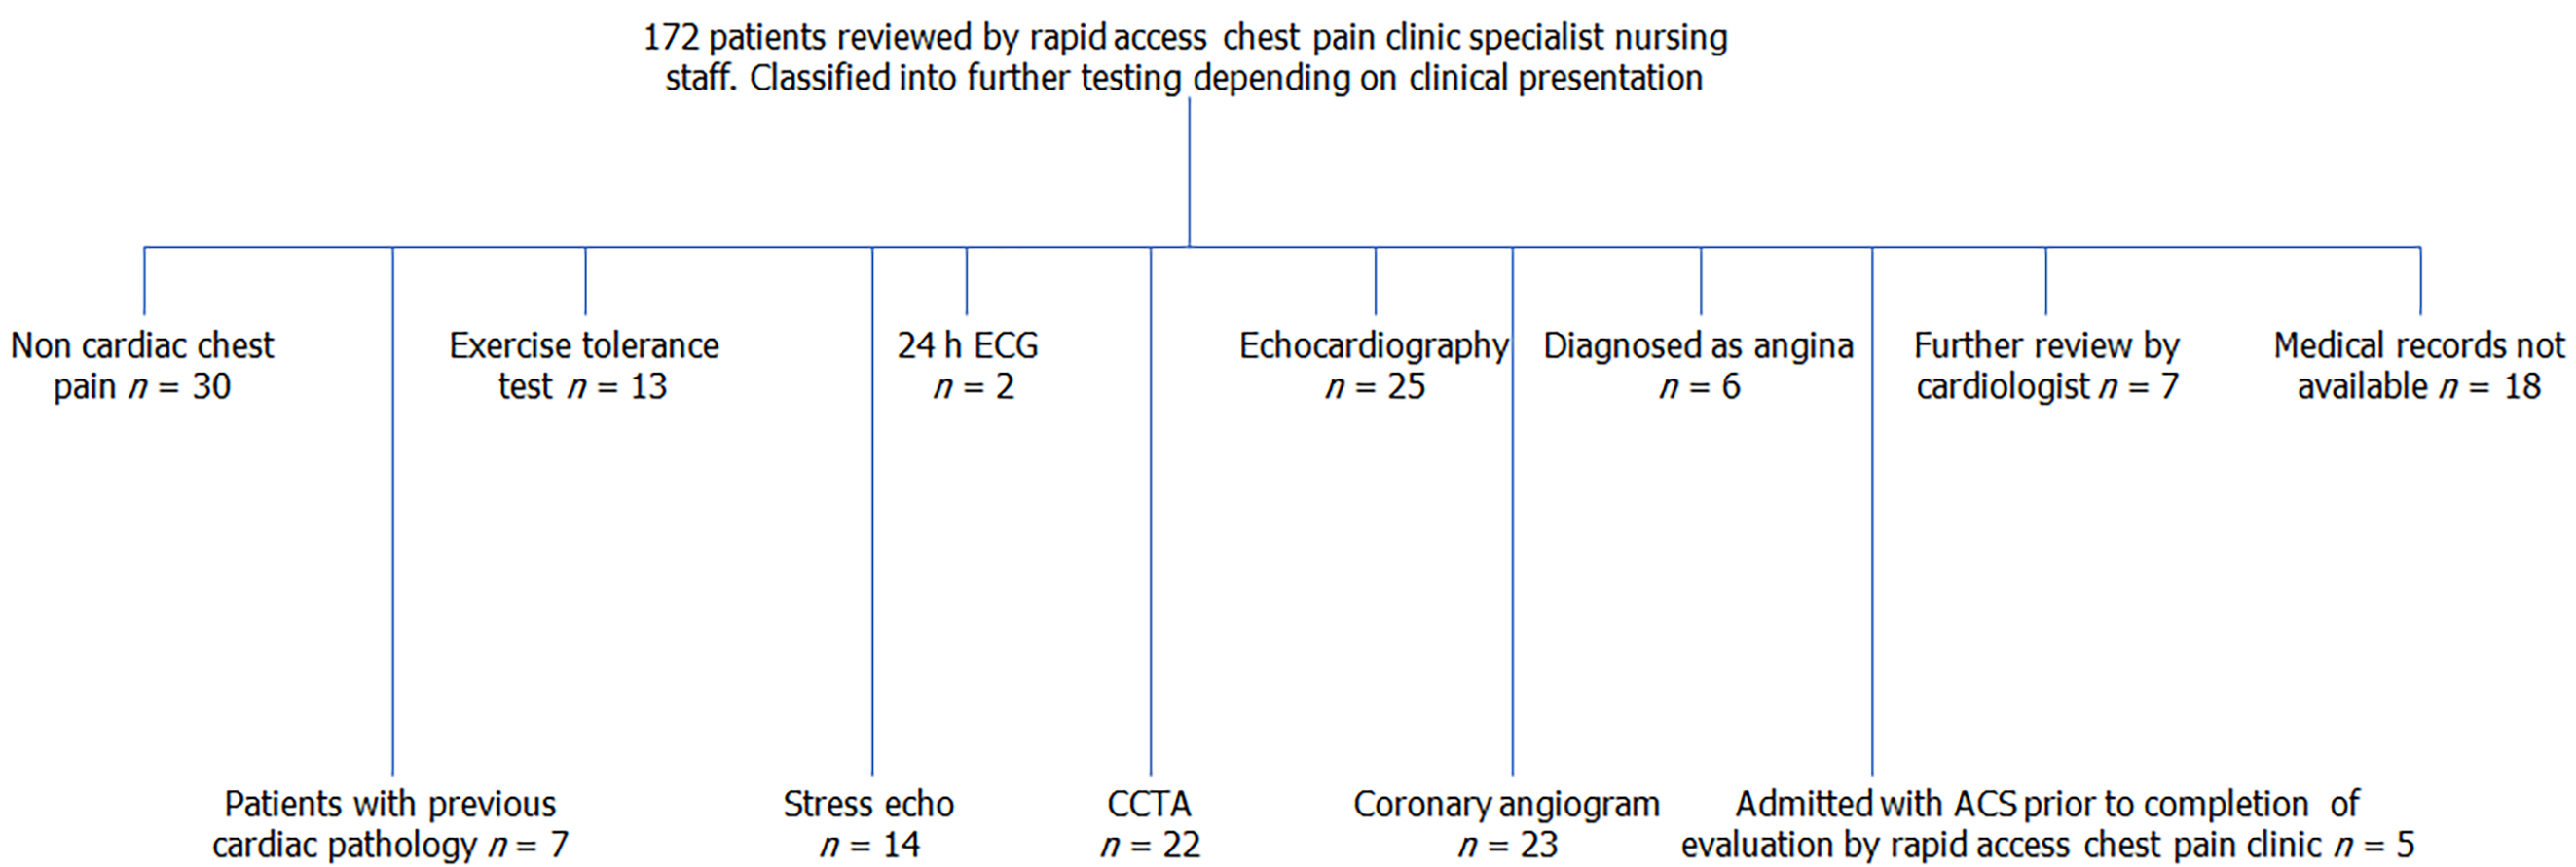
Figure 1 Patient flow chart according to further investigation.
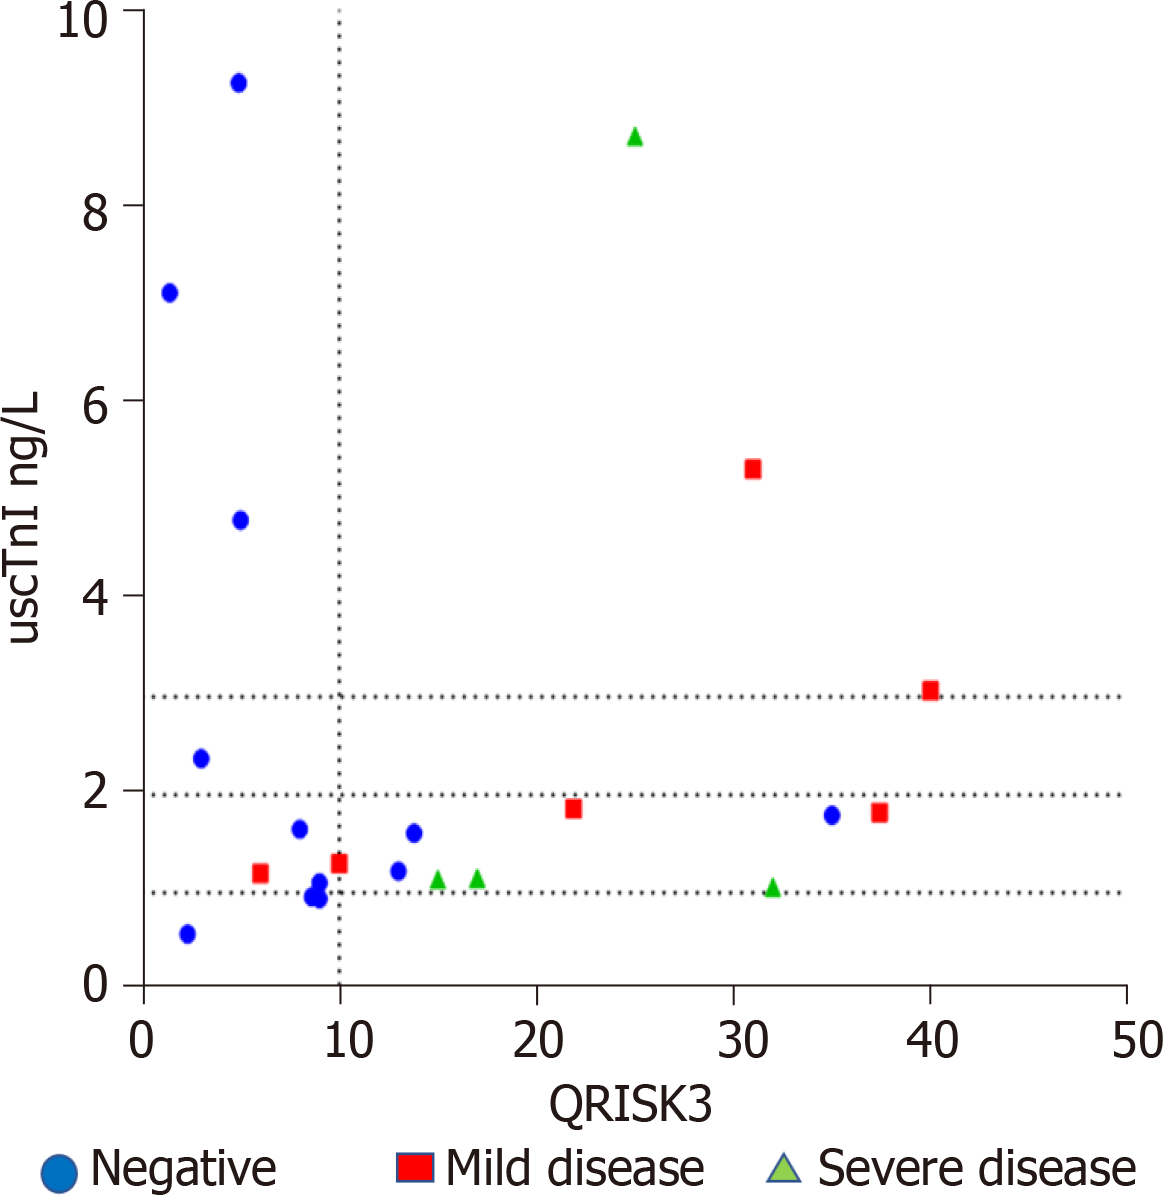
Figure 2 QRISK3 and uscTnI profile in patients assigned to coronary computed tomography angiography.
Vertical dotted line represent QRISK3 values of 10%, and the horizontal dotted lines represent uscTnI values of 1, 2 and 3 ng/L. The lower left hand quadrant represents a QRISK value of < 10% and uscTnI values < 1 ng/L. Three patients classified as negative by computerized tomography coronary angiogram fall within the quadrant.
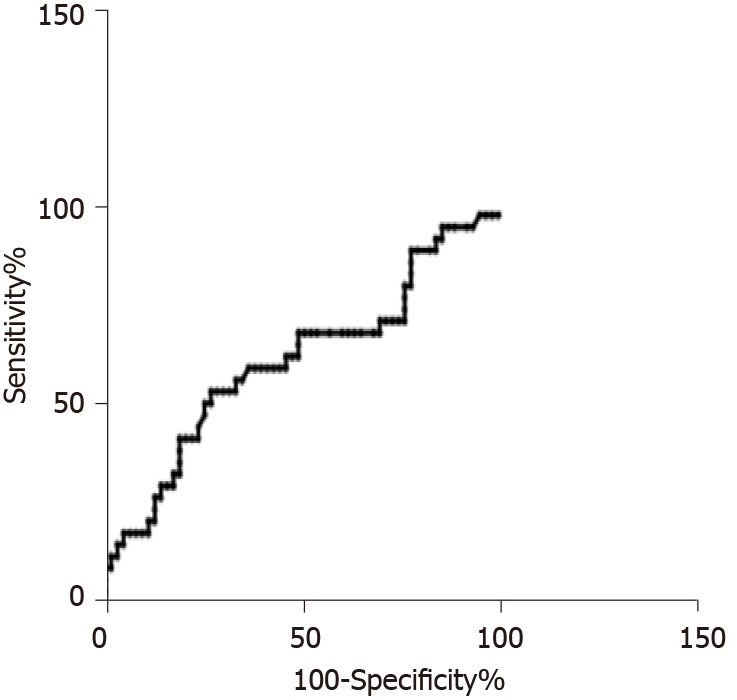
Figure 3 Receiver operating characteristic curves for uscTnI in patients allocated to functional testing (Exercise tolerance test, Echocardiogram, Stress echocardiogram), coronary computed tomography angiography and coronary angiogram.
Patients were diagnosed with coronary artery disease based on patient follow-up tests.
- Citation: Ramasamy I. Highly sensitive troponin I assay in the diagnosis of coronary artery disease in patients with suspected stable angina. World J Cardiol 2021; 13(12): 745-757
- URL: https://www.wjgnet.com/1949-8462/full/v13/i12/745.htm
- DOI: https://dx.doi.org/10.4330/wjc.v13.i12.745


