Copyright
©The Author(s) 2021.
World J Cardiol. Dec 26, 2021; 13(12): 745-757
Published online Dec 26, 2021. doi: 10.4330/wjc.v13.i12.745
Published online Dec 26, 2021. doi: 10.4330/wjc.v13.i12.745
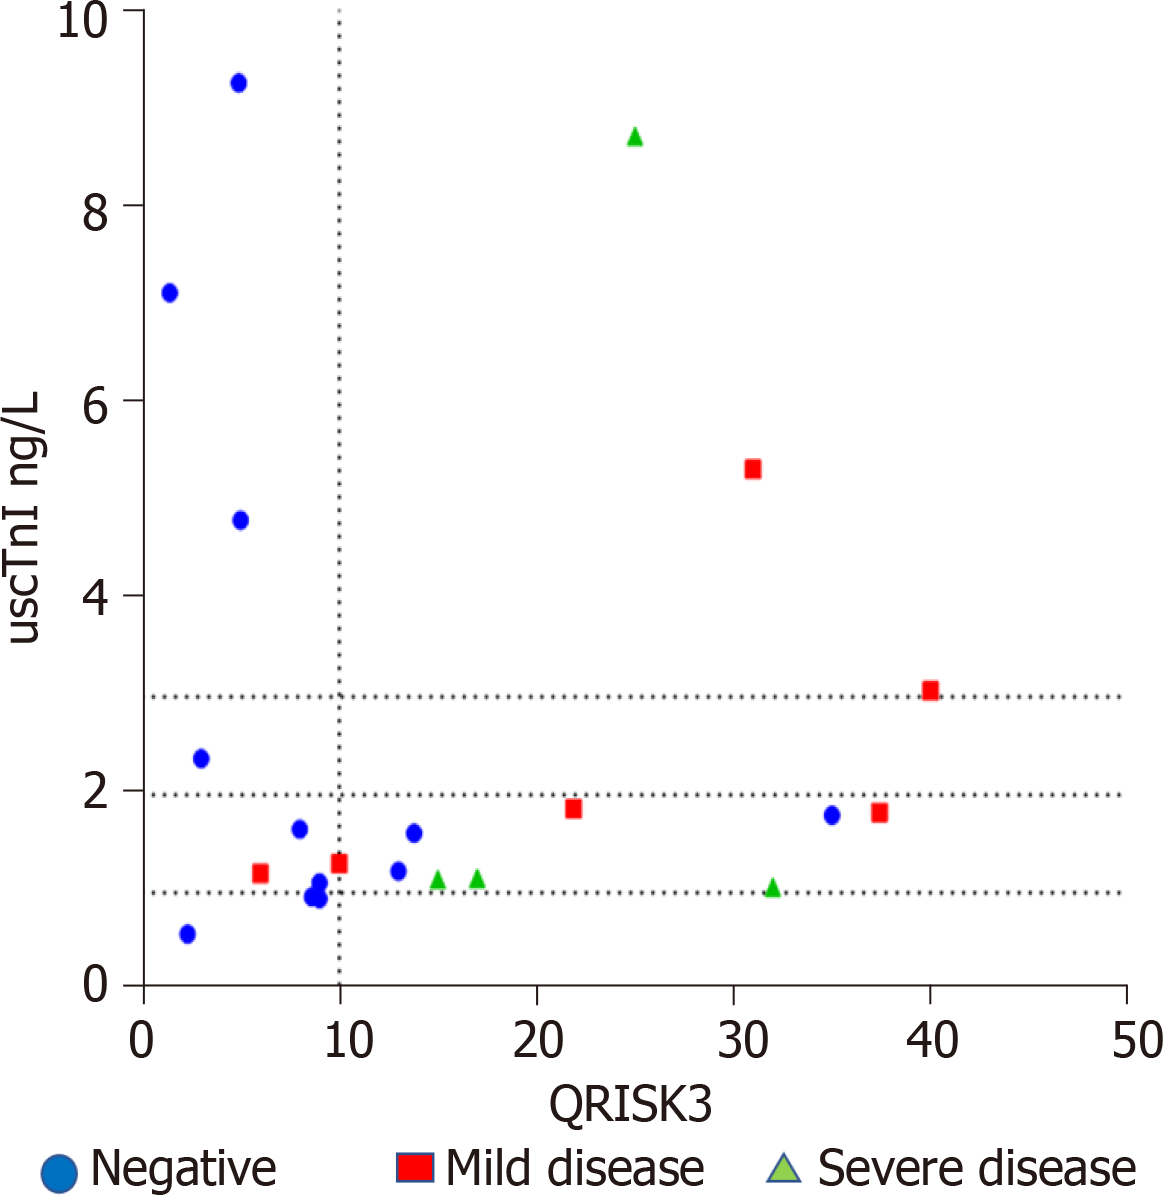
Figure 2 QRISK3 and uscTnI profile in patients assigned to coronary computed tomography angiography.
Vertical dotted line represent QRISK3 values of 10%, and the horizontal dotted lines represent uscTnI values of 1, 2 and 3 ng/L. The lower left hand quadrant represents a QRISK value of < 10% and uscTnI values < 1 ng/L. Three patients classified as negative by computerized tomography coronary angiogram fall within the quadrant.
- Citation: Ramasamy I. Highly sensitive troponin I assay in the diagnosis of coronary artery disease in patients with suspected stable angina. World J Cardiol 2021; 13(12): 745-757
- URL: https://www.wjgnet.com/1949-8462/full/v13/i12/745.htm
- DOI: https://dx.doi.org/10.4330/wjc.v13.i12.745


