Copyright
©The Author(s) 2016.
World J Diabetes. Nov 15, 2016; 7(19): 483-514
Published online Nov 15, 2016. doi: 10.4239/wjd.v7.i19.483
Published online Nov 15, 2016. doi: 10.4239/wjd.v7.i19.483
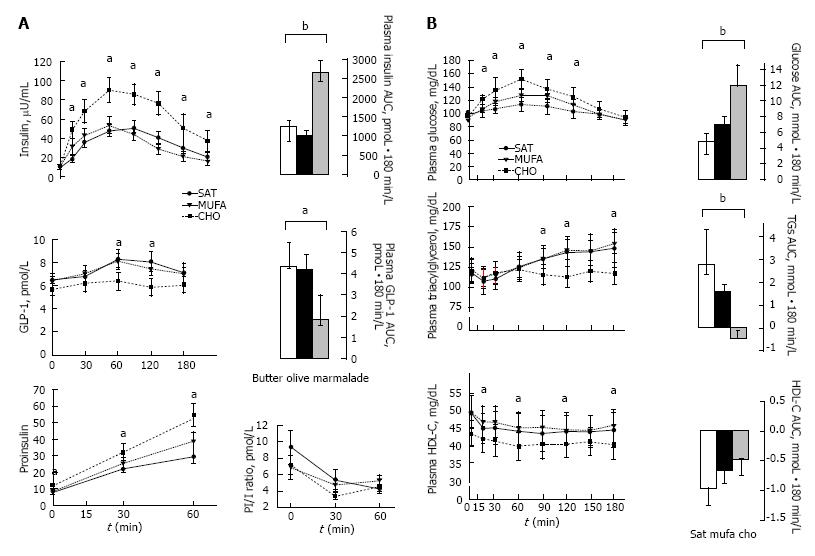
Figure 5 Mean (± SE) postprandial responses of insulin, proinsulin and glucagon-like peptide-1 levels (A), and glucose, triacylglycerol and high-density lipoprotein cholesterol levels (B), in 11 insulin-resistant subjects to three isocaloric (443 kcal) standard breakfasts.
A breakfast rich in carbohydrates, a Mediterranean breakfast enriched with extra-virgin olive oil and standard breakfast high in saturated fat. The incremental AUC was calculated by the formula based on the trapezoid rule with adjustment for baseline concentrations. Repeated measures ANOVA and Tukey’s test. aP < 0.05; bP < 0.01[237]. CHO: High-carbohydrate; MUFA: Monounsaturated fatty acids; AUC: Area under the curve; ANOVA: Analysis of variance.
- Citation: Paniagua JA. Nutrition, insulin resistance and dysfunctional adipose tissue determine the different components of metabolic syndrome. World J Diabetes 2016; 7(19): 483-514
- URL: https://www.wjgnet.com/1948-9358/full/v7/i19/483.htm
- DOI: https://dx.doi.org/10.4239/wjd.v7.i19.483


