Copyright
©The Author(s) 2022.
World J Diabetes. Oct 15, 2022; 13(10): 888-899
Published online Oct 15, 2022. doi: 10.4239/wjd.v13.i10.888
Published online Oct 15, 2022. doi: 10.4239/wjd.v13.i10.888
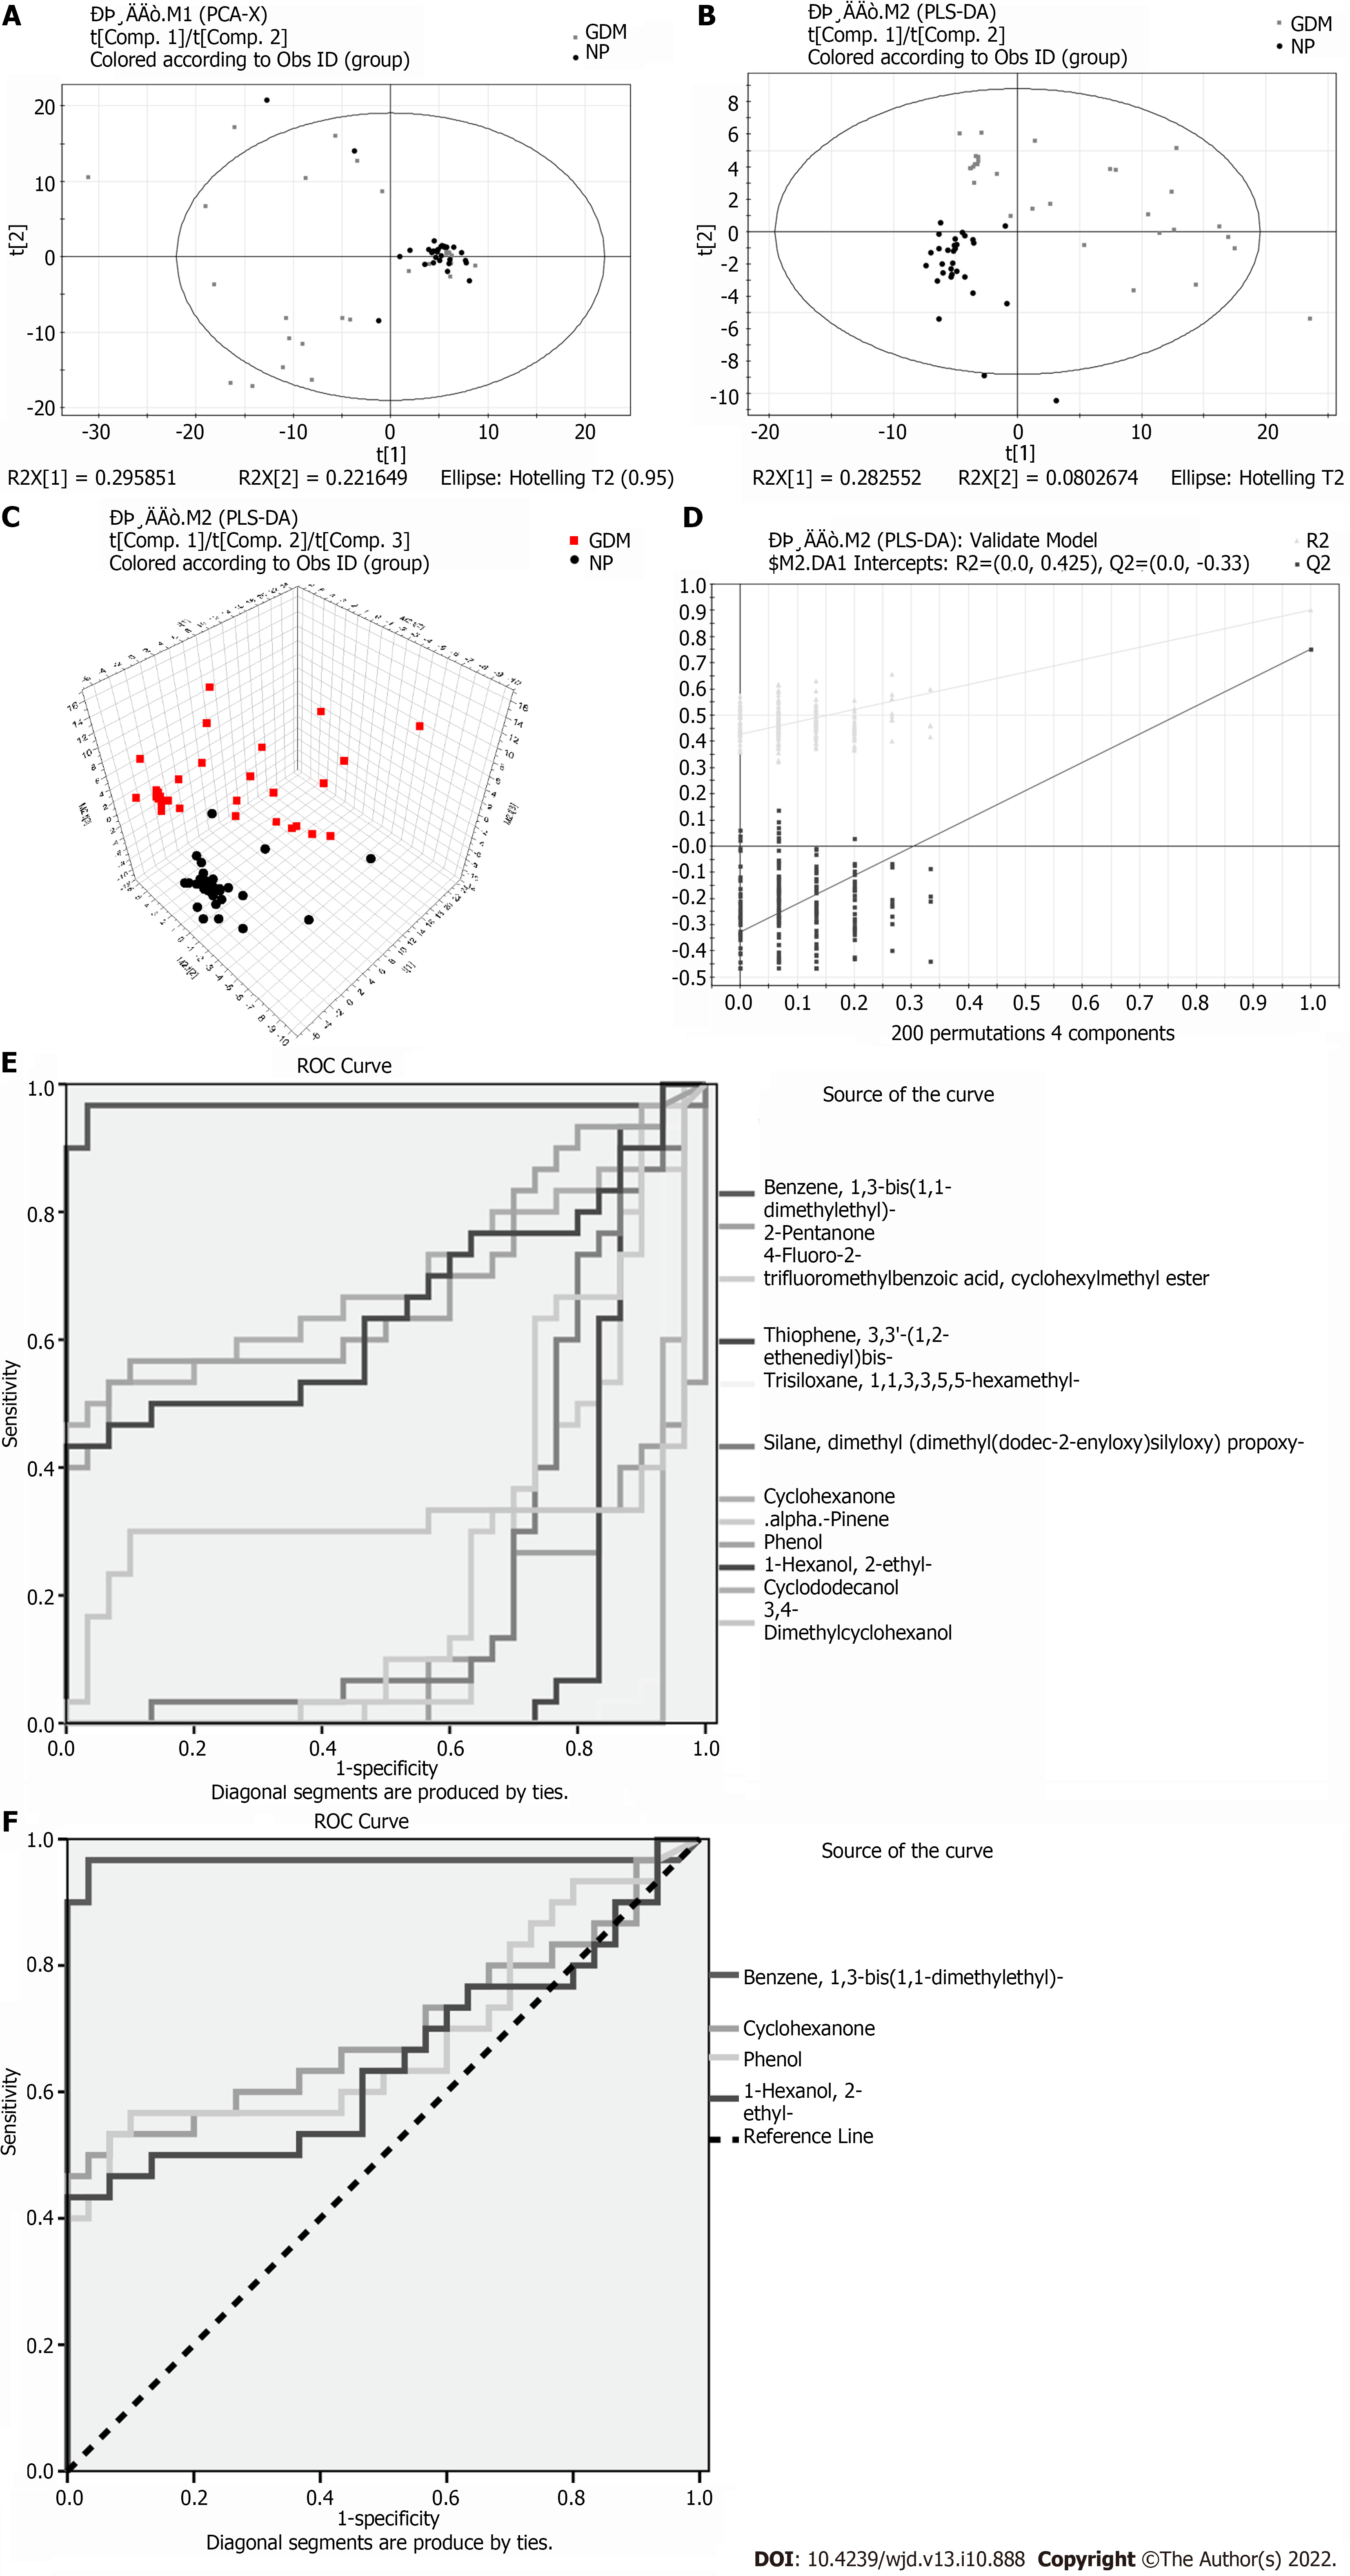
Figure 3 Metabolomic analysis of urine between groups.
A: Principal component analysis score plot; B and C: Partial least squares-discriminant analysis (PLS-DA) score plots (R2X[1] = 0.295851, R2X[2] = 0.221649, T2 = 0.95); D: PLS-DA validation plot intercepts: R2 = (0.0, 0.425), Q2 = (0.0, -0.33); E and F: Receiver operating characteristic curves of differential substances from urine. GDM: Gestational diabetes mellitus; NP: Normal pregnancy; ROC: Receiver operating characteristic.
- Citation: Sana SRGL, Chen GM, Lv Y, Guo L, Li EY. Metabonomics fingerprint of volatile organic compounds in serum and urine of pregnant women with gestational diabetes mellitus. World J Diabetes 2022; 13(10): 888-899
- URL: https://www.wjgnet.com/1948-9358/full/v13/i10/888.htm
- DOI: https://dx.doi.org/10.4239/wjd.v13.i10.888


