Copyright
©The Author(s) 2021.
World J Diabetes. Nov 15, 2021; 12(11): 1875-1893
Published online Nov 15, 2021. doi: 10.4239/wjd.v12.i11.1875
Published online Nov 15, 2021. doi: 10.4239/wjd.v12.i11.1875
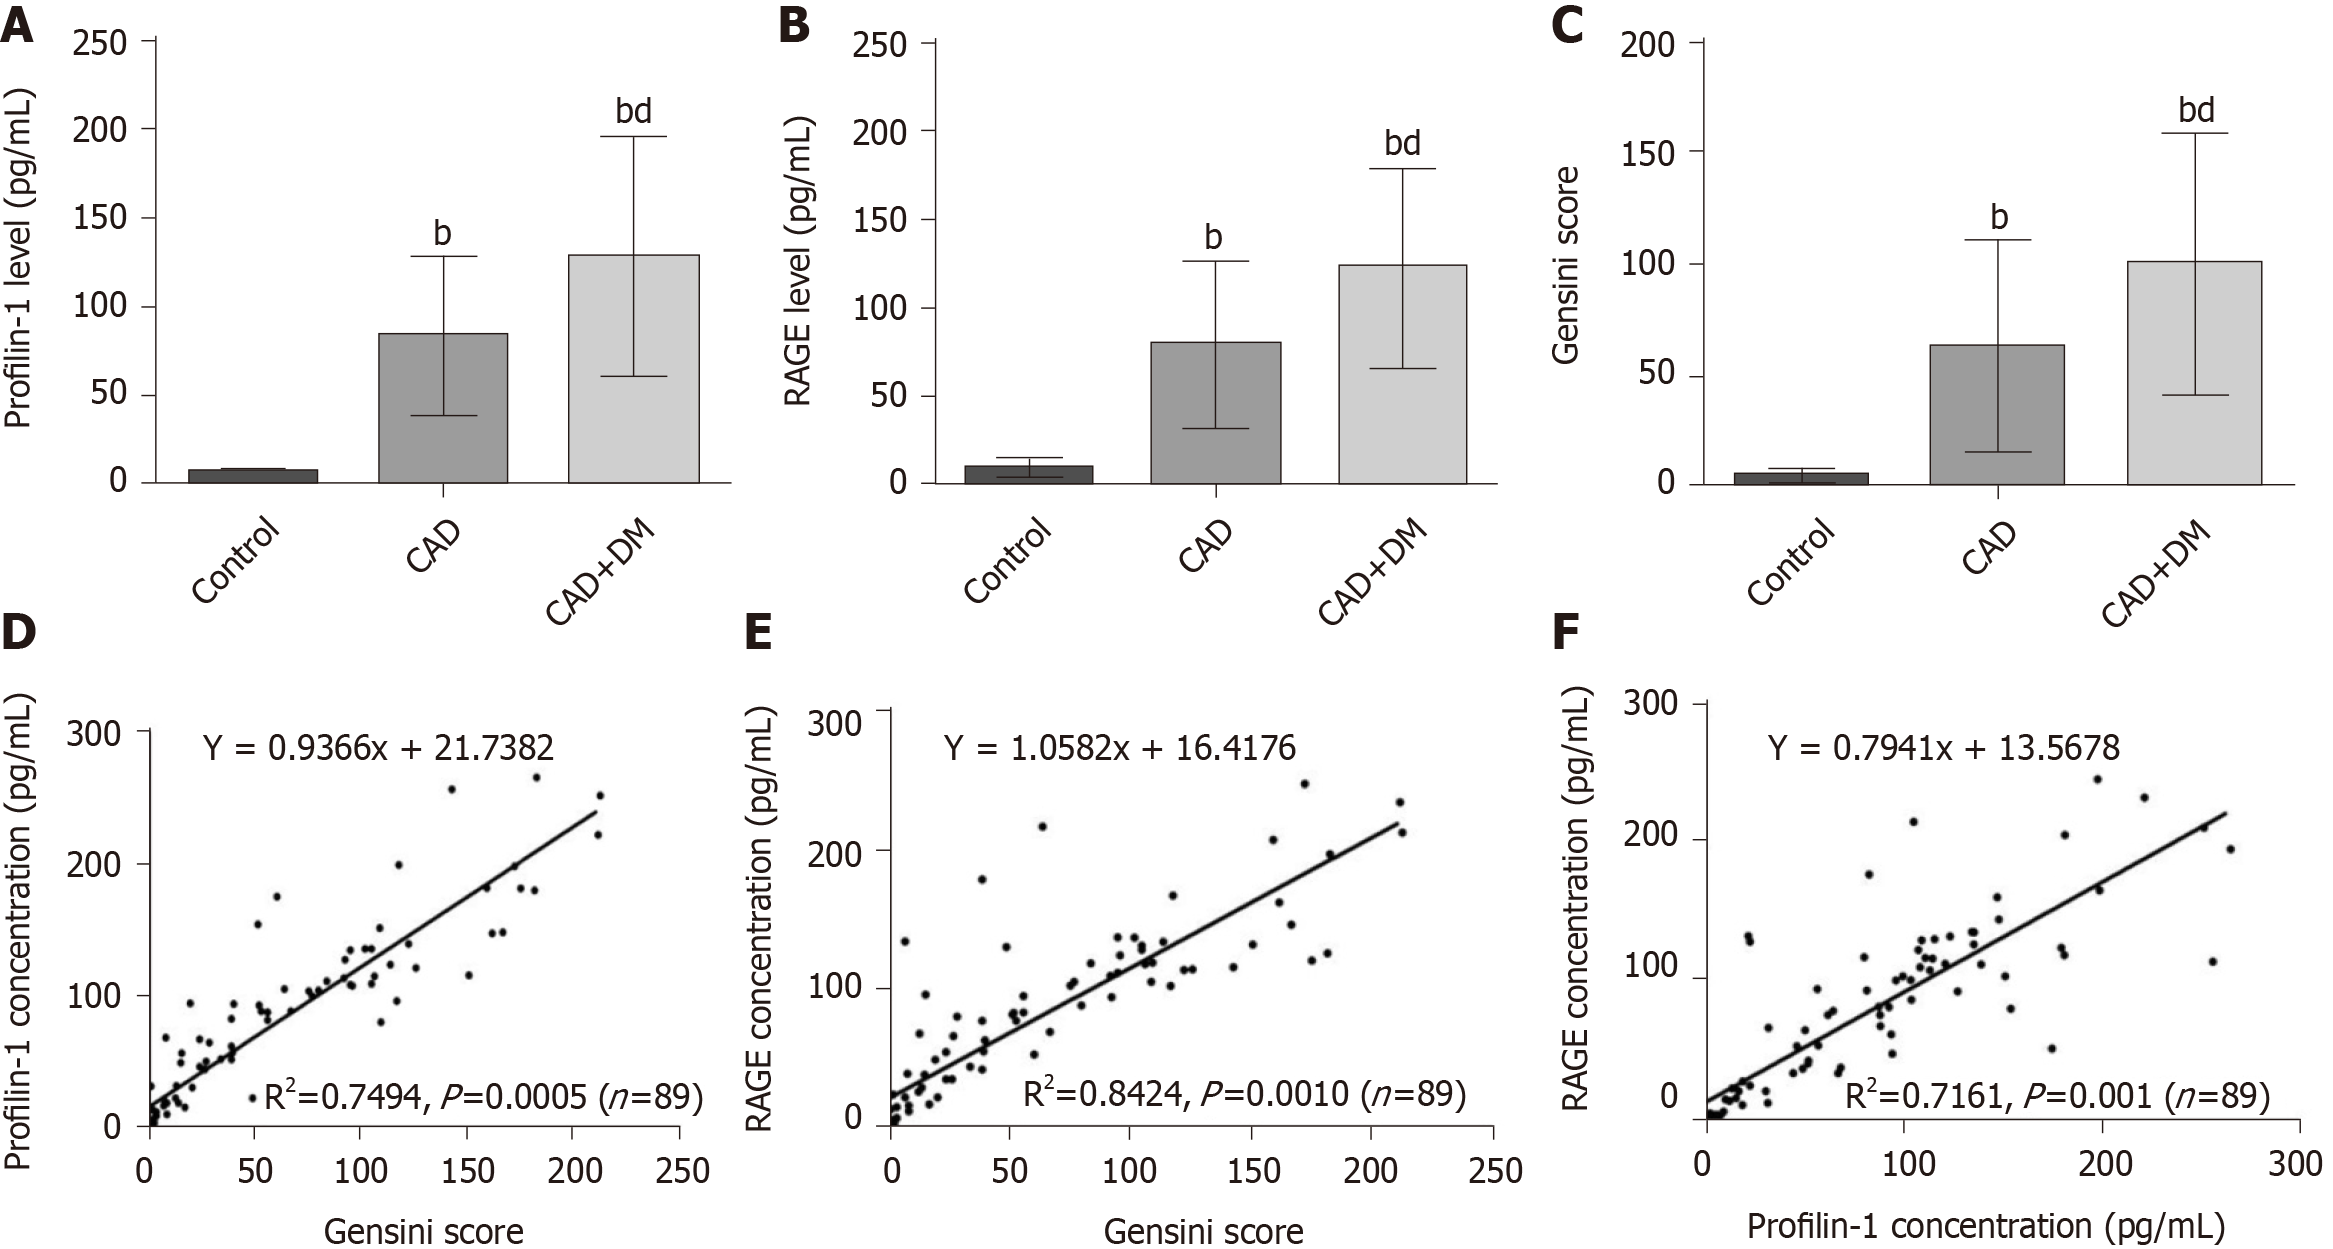
Figure 1 Relationships between profilin-1, receptor for advanced glycation end products, and Gensini scores.
A-C: Plasma profilin-1 and receptor for advanced glycation end products (RAGE) levels and Gensini scores in different groups. bP < 0.01 compared with the control group, dP < 0.01 compared with the coronary artery disease group; D-F: Pearson correlation analysis showing the relationship between profilin-1 or RAGE levels and Gensini score, as well as the relationship between profilin-1 and RAGE levels. CAD: Coronary artery disease; DM: Diabetes mellitus; RAGE: Receptor for advanced glycation end products.
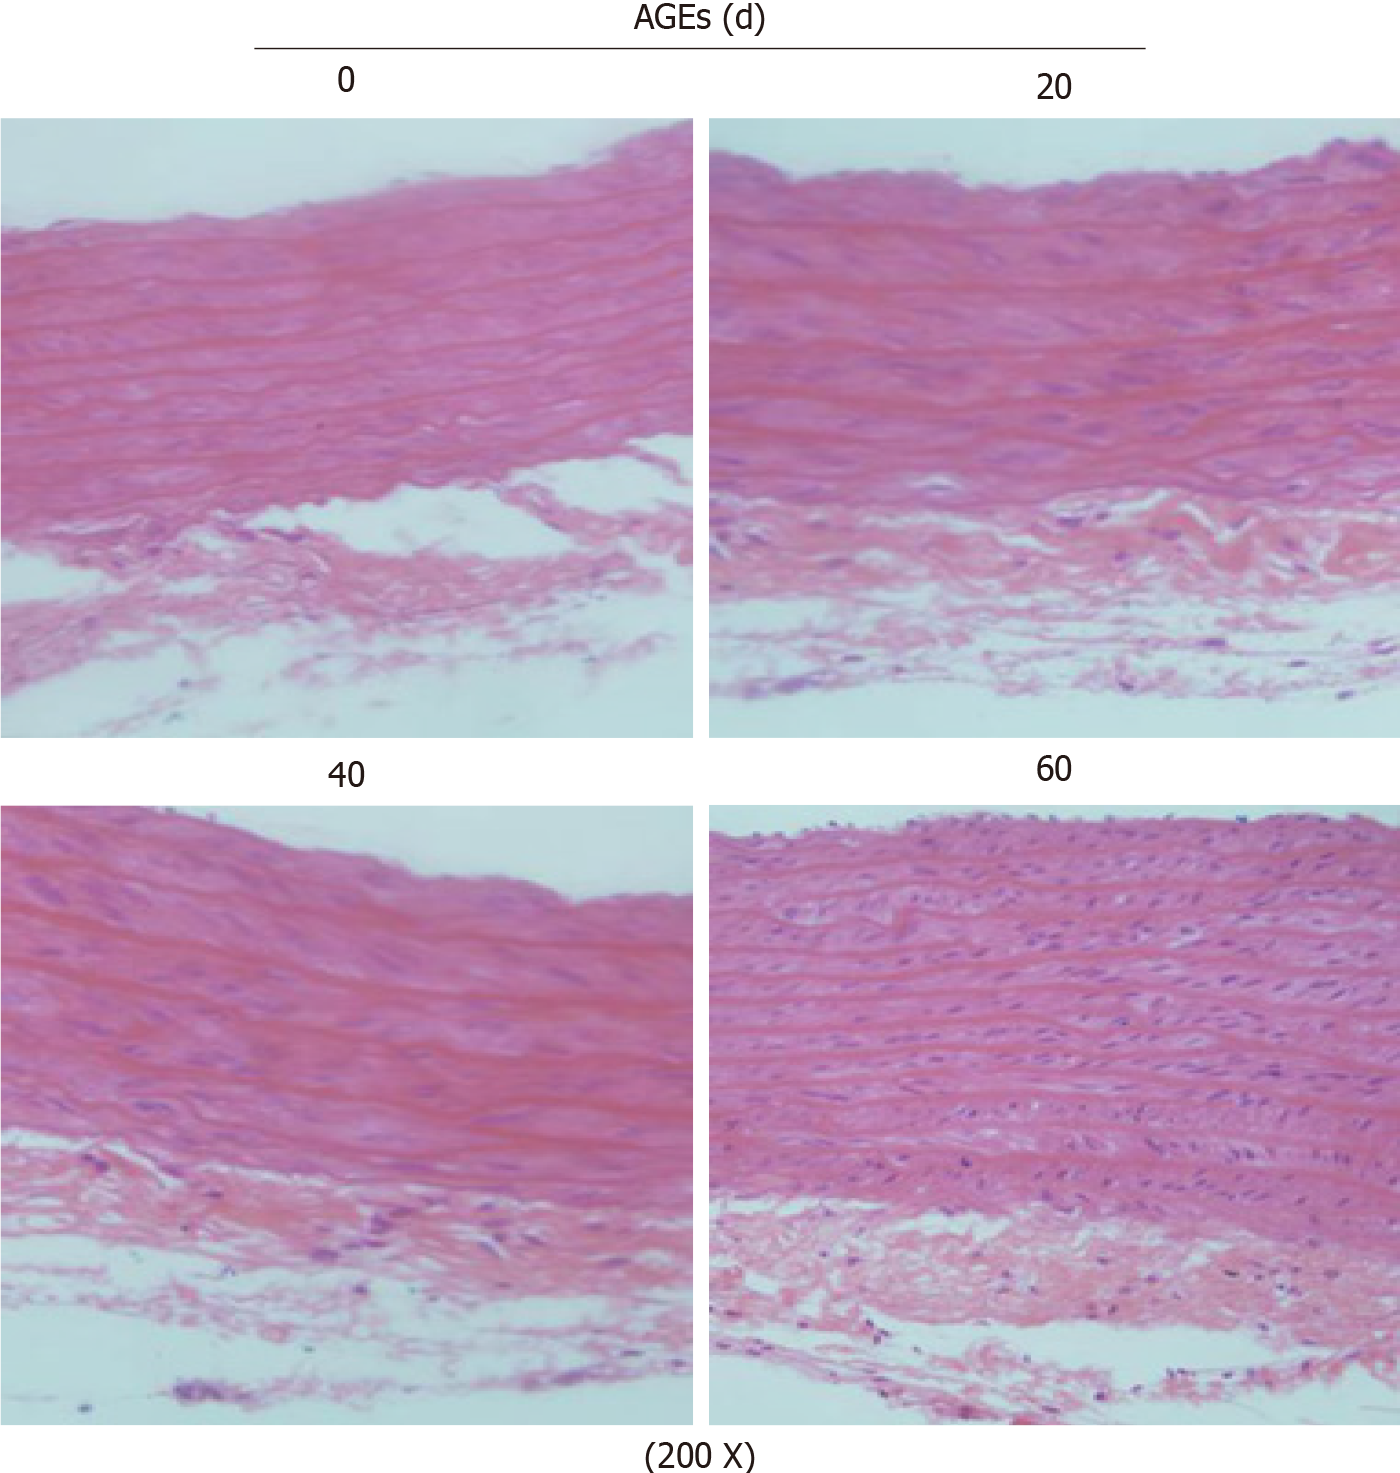
Figure 2 Hematoxylin and eosin staining (200 ×) showing the morphological characteristics of the thoracic aorta in advanced glycation end products-injected rats (n = 3).
AGEs: Advanced glycation end products.
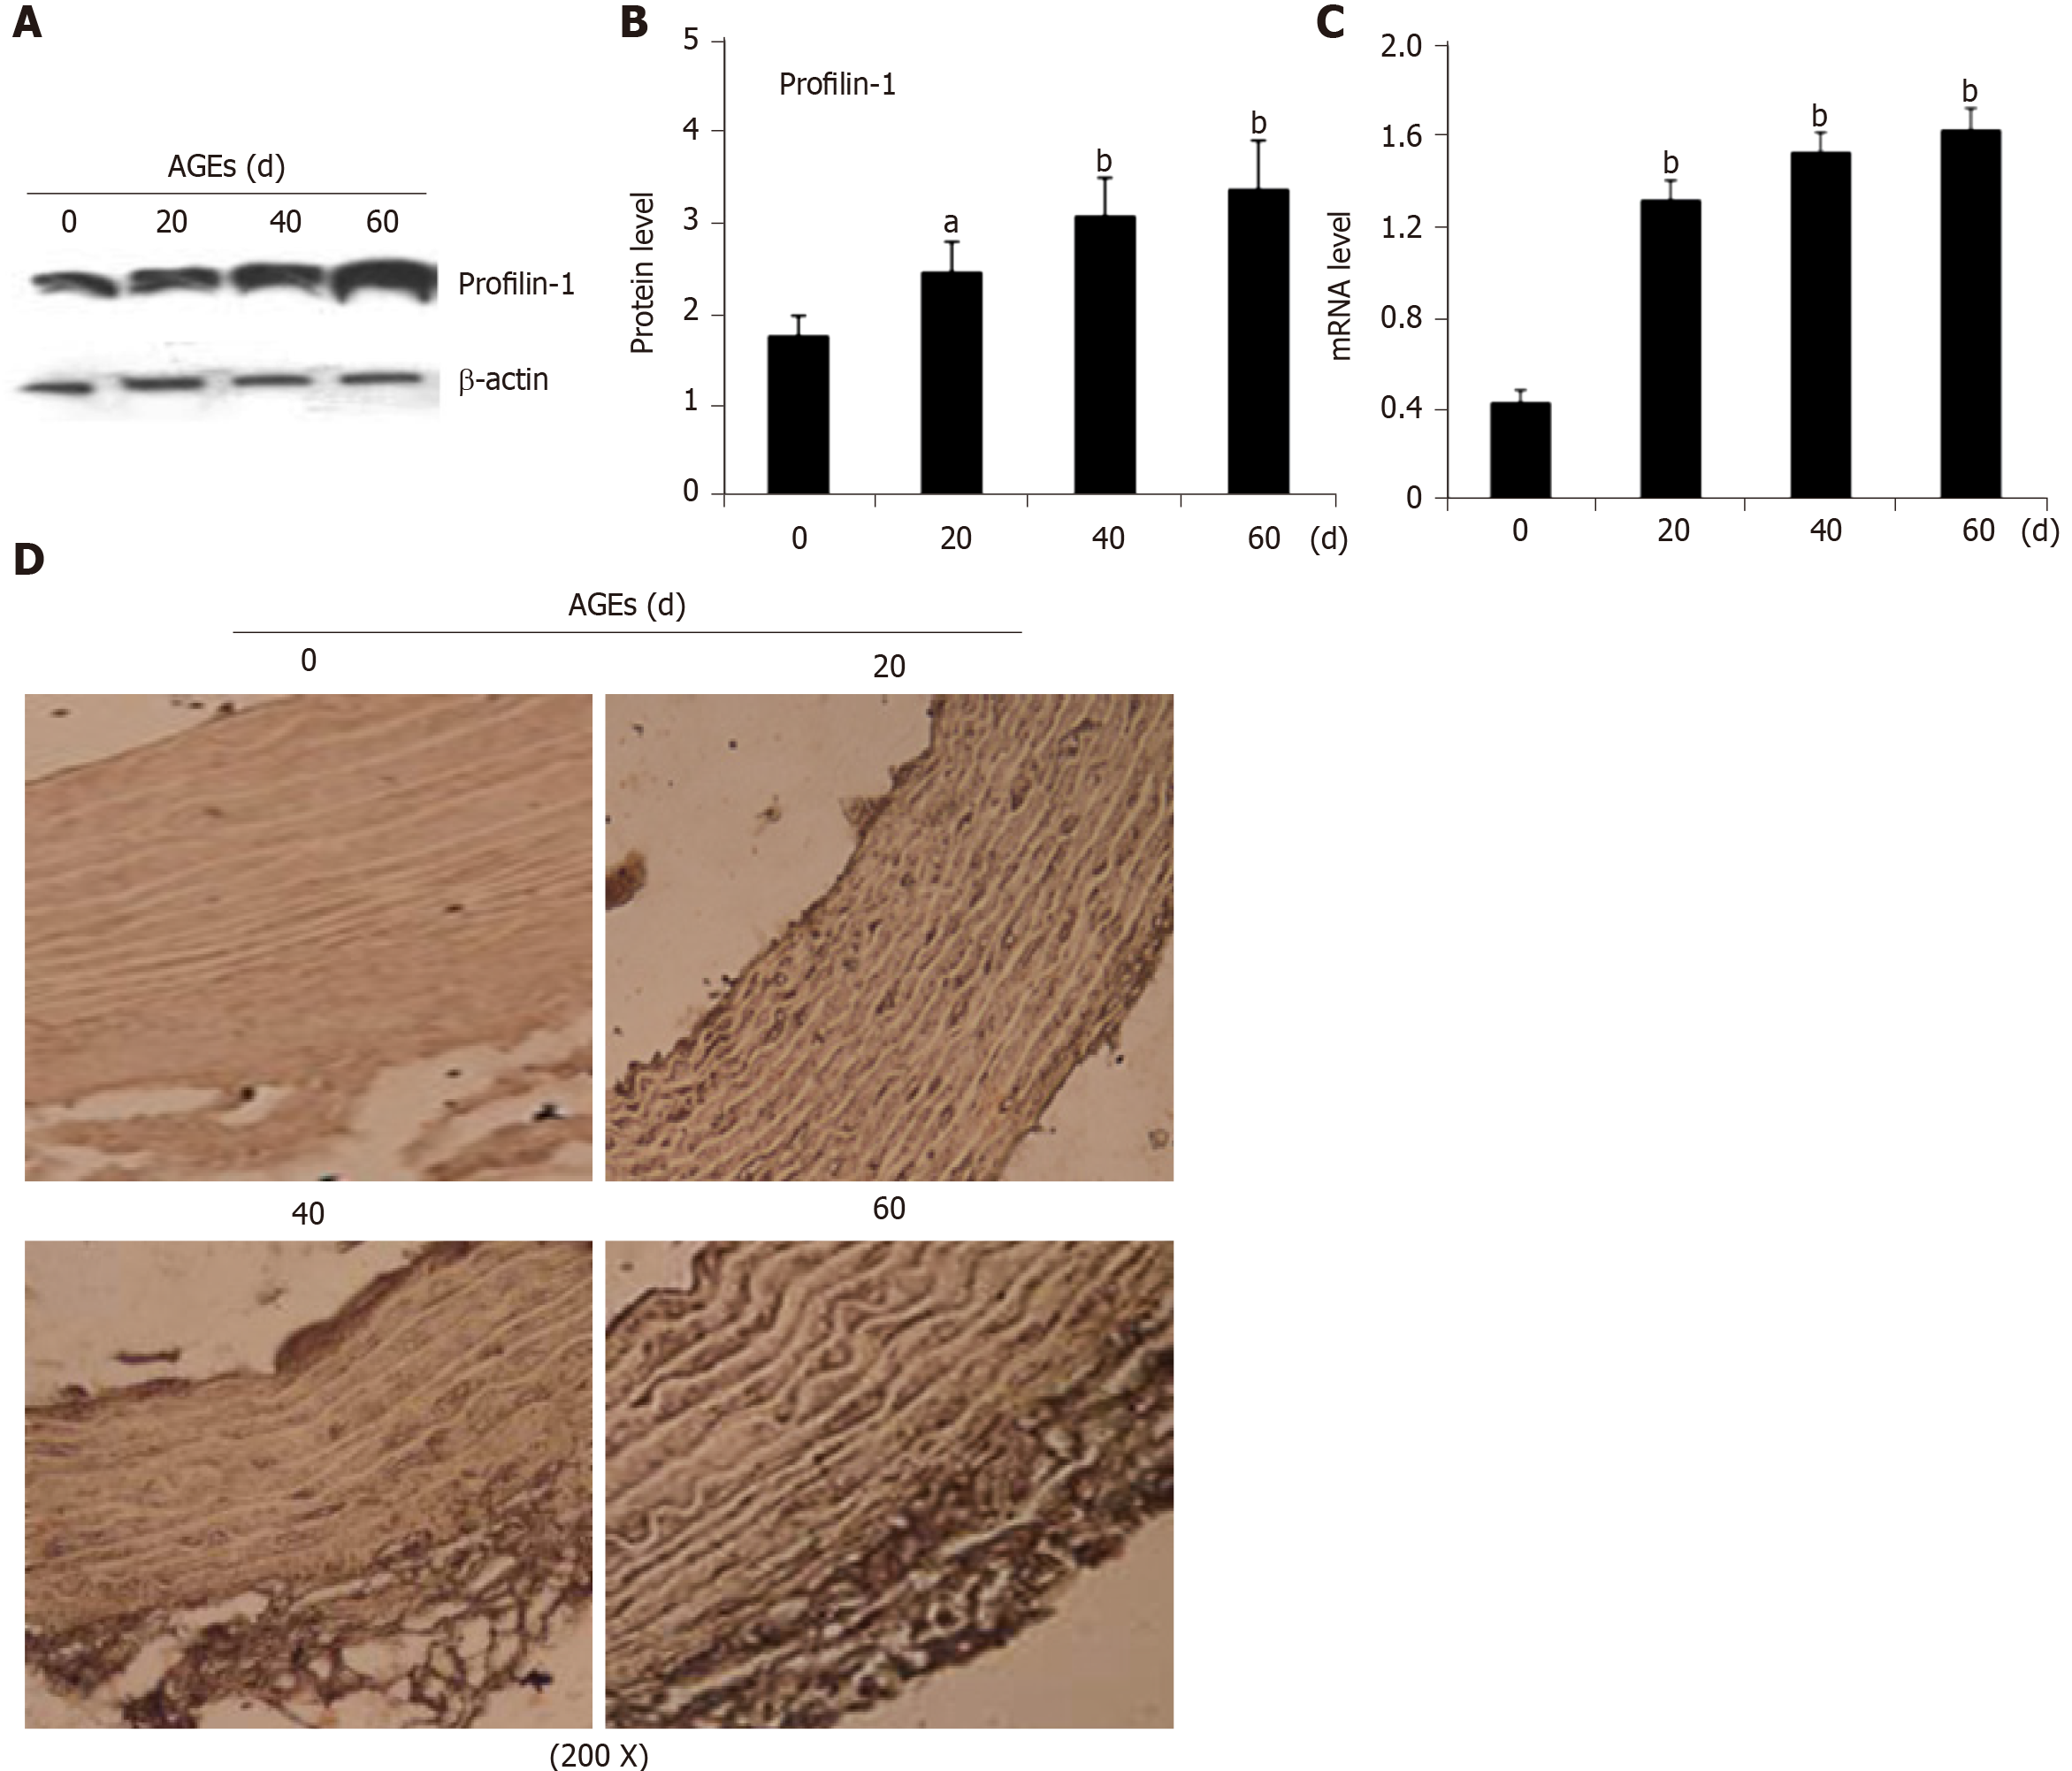
Figure 3 Expression of profilin-1 in the thoracic aortas of advanced glycation end products-injected rats.
A-C: Western blot analysis and real-time PCR detection of the expression of the profilin-1 protein and mRNA, respectively, in the thoracic aorta. n = 3, aP < 0.05 compared with the control group, bP < 0.01 compared with the control group; D: Immunohistochemical staining revealing the expression of the profilin-1 protein in the thoracic aorta. Under a microscope at 200 × magnification, the profilin-1 protein was stained brown using the SABC immunohistochemical method, n = 3. AGEs: Advanced glycation end products.
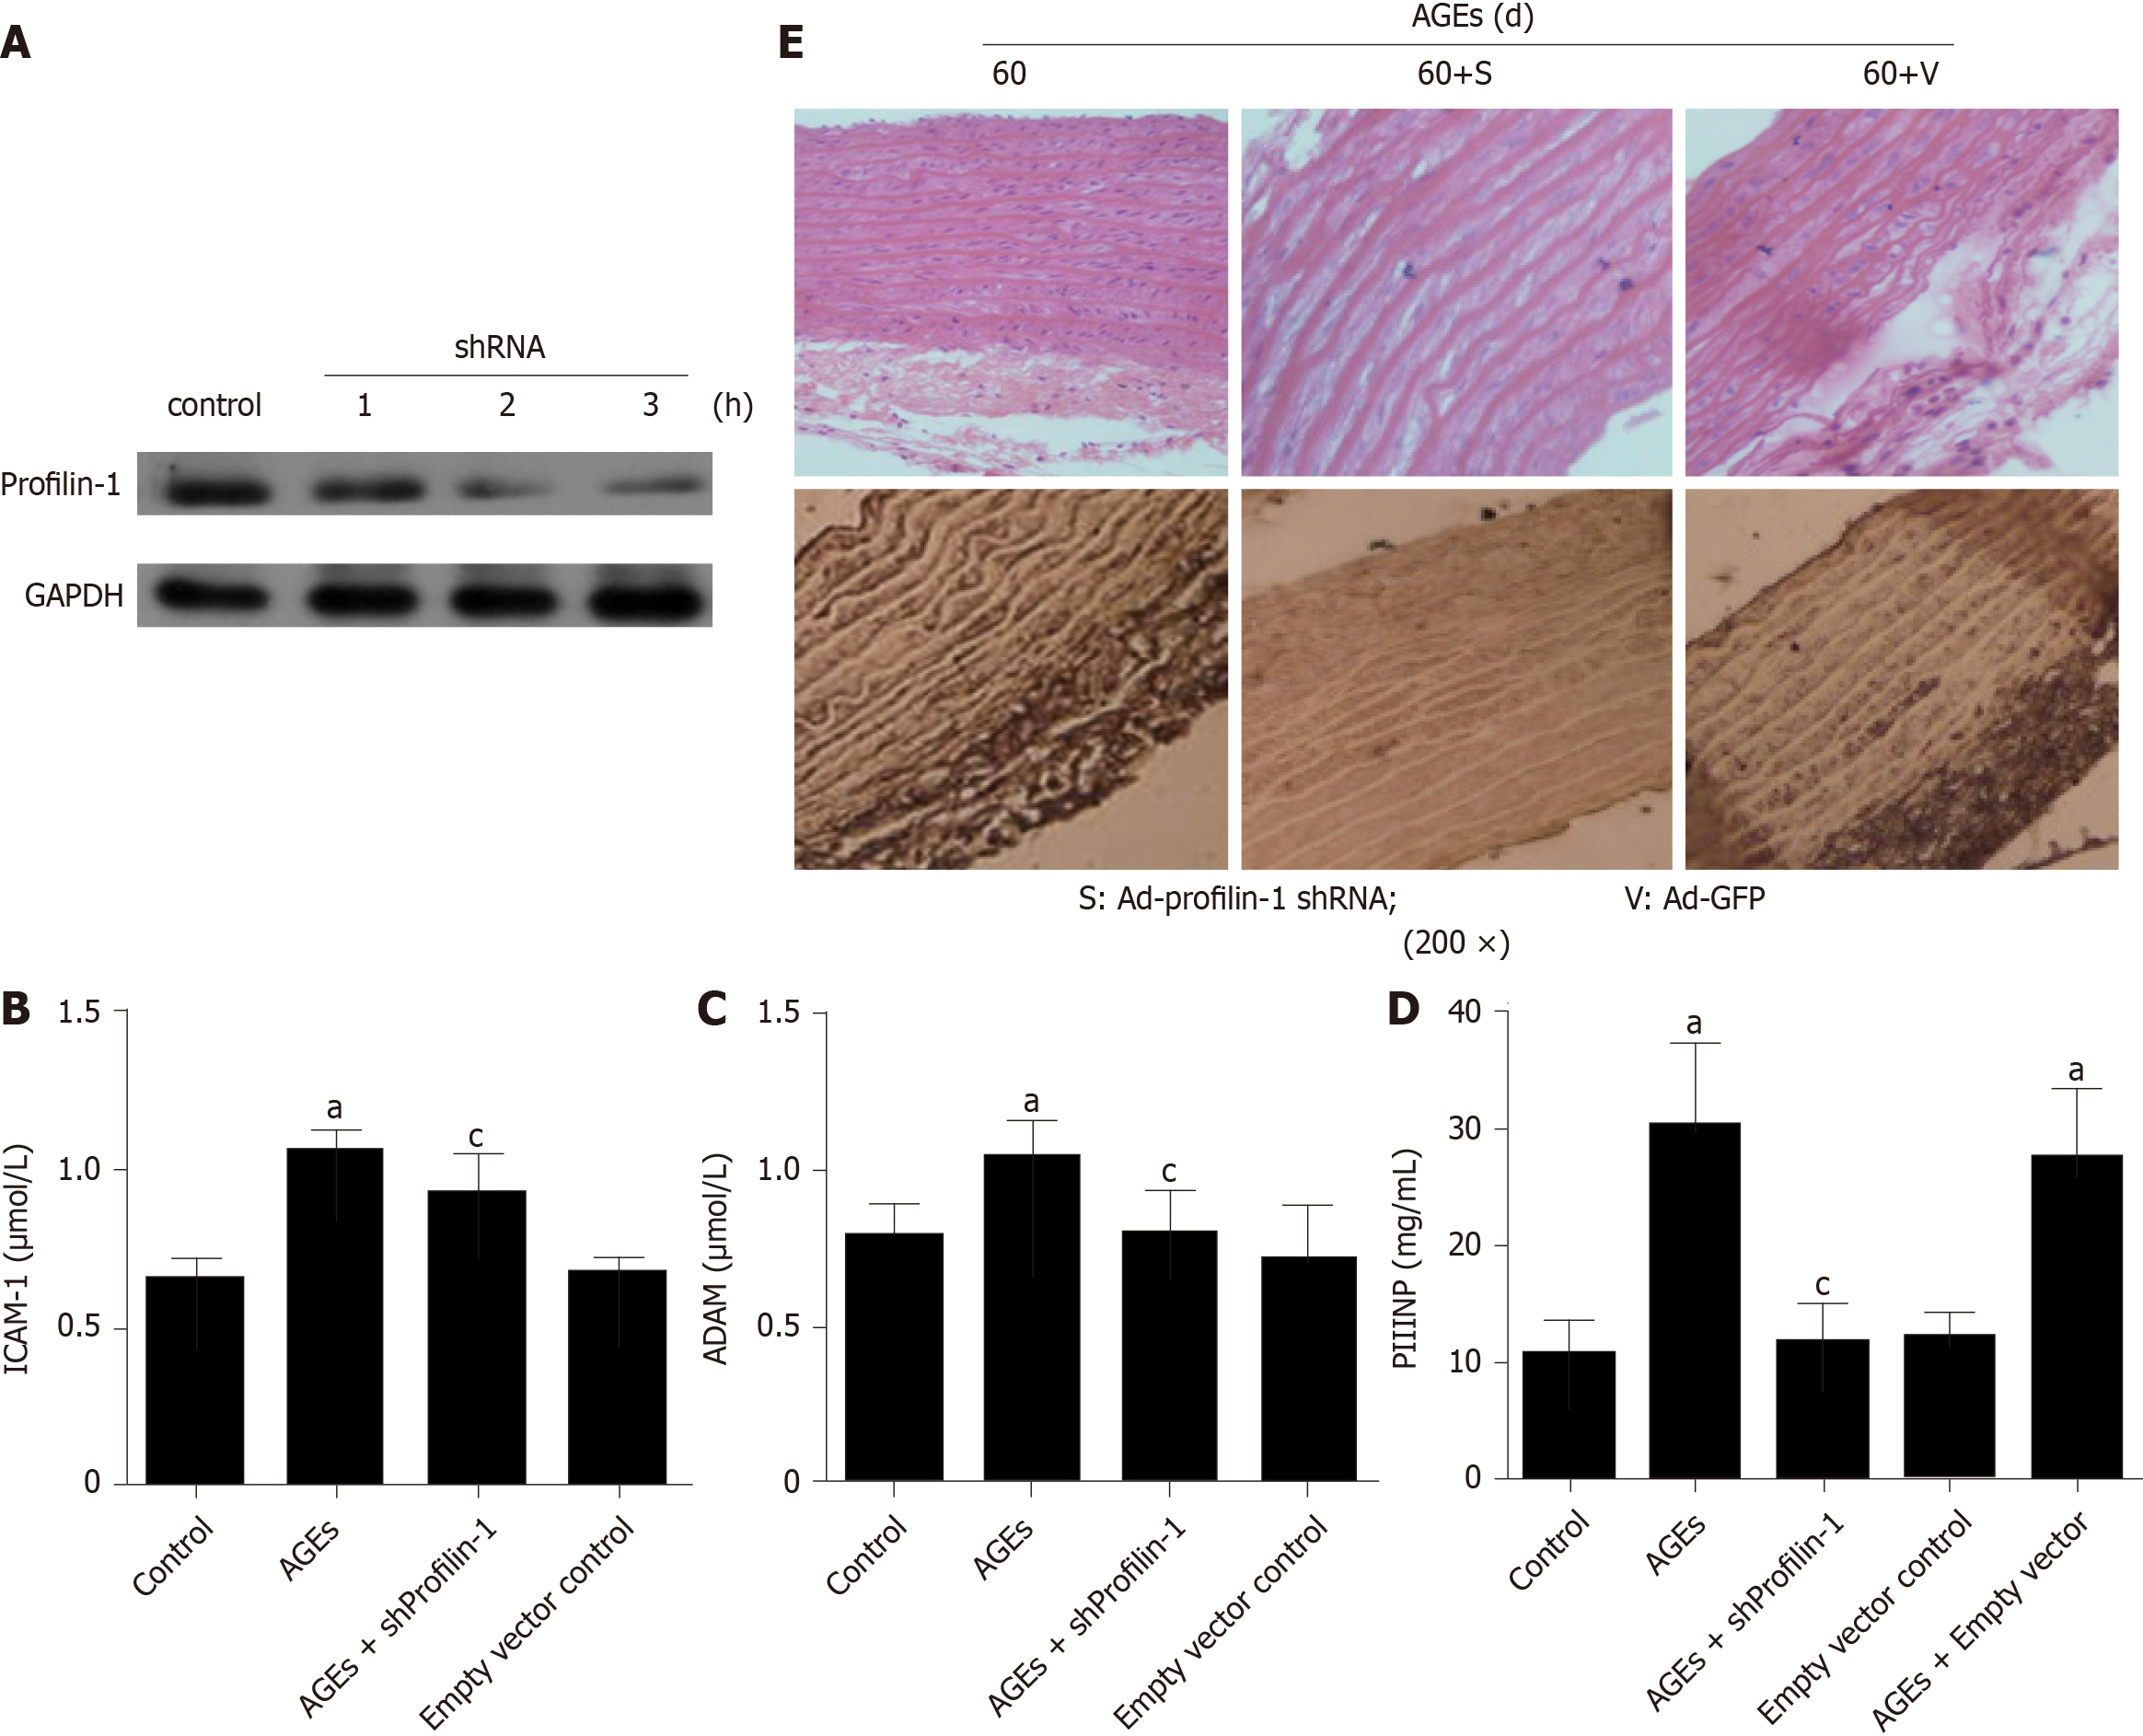
Figure 4 Effect of profilin-1 shRNA on the levels of inflammatory mediators and vascular remodeling in advanced glycation end products-injected rats.
A: Western blot analysis of the transfection efficiency of the profilin-1 shRNA, n = 3; B-D: ELISA or HPLC was used to detect the intercellular adhesion molecule-1, N-terminal procollagen III peptide, and asymmetric dimethylarginine levels in different groups. n = 3, aP < 0.05 compared with the control group, cP < 0.05 compared with the advanced glycation end products (AGEs) group; E: Hematoxylin and eosin or immunohistochemistry staining showing the effect of profilin-1 silencing on the morphological characteristics of the thoracic aorta and the expression of the profilin-1 protein in AGEs-injected rats. Under a microscope at 200 × magnification, the profilin-1 protein was stained brown using the SABC immunohistochemical method, n = 3. ICAM-1: Intercellular adhesion molecule-1; PIIINP: N-terminal procollagen III peptide; ADMA: Asymmetric dimethylarginine; AGEs: Advanced glycation end products.
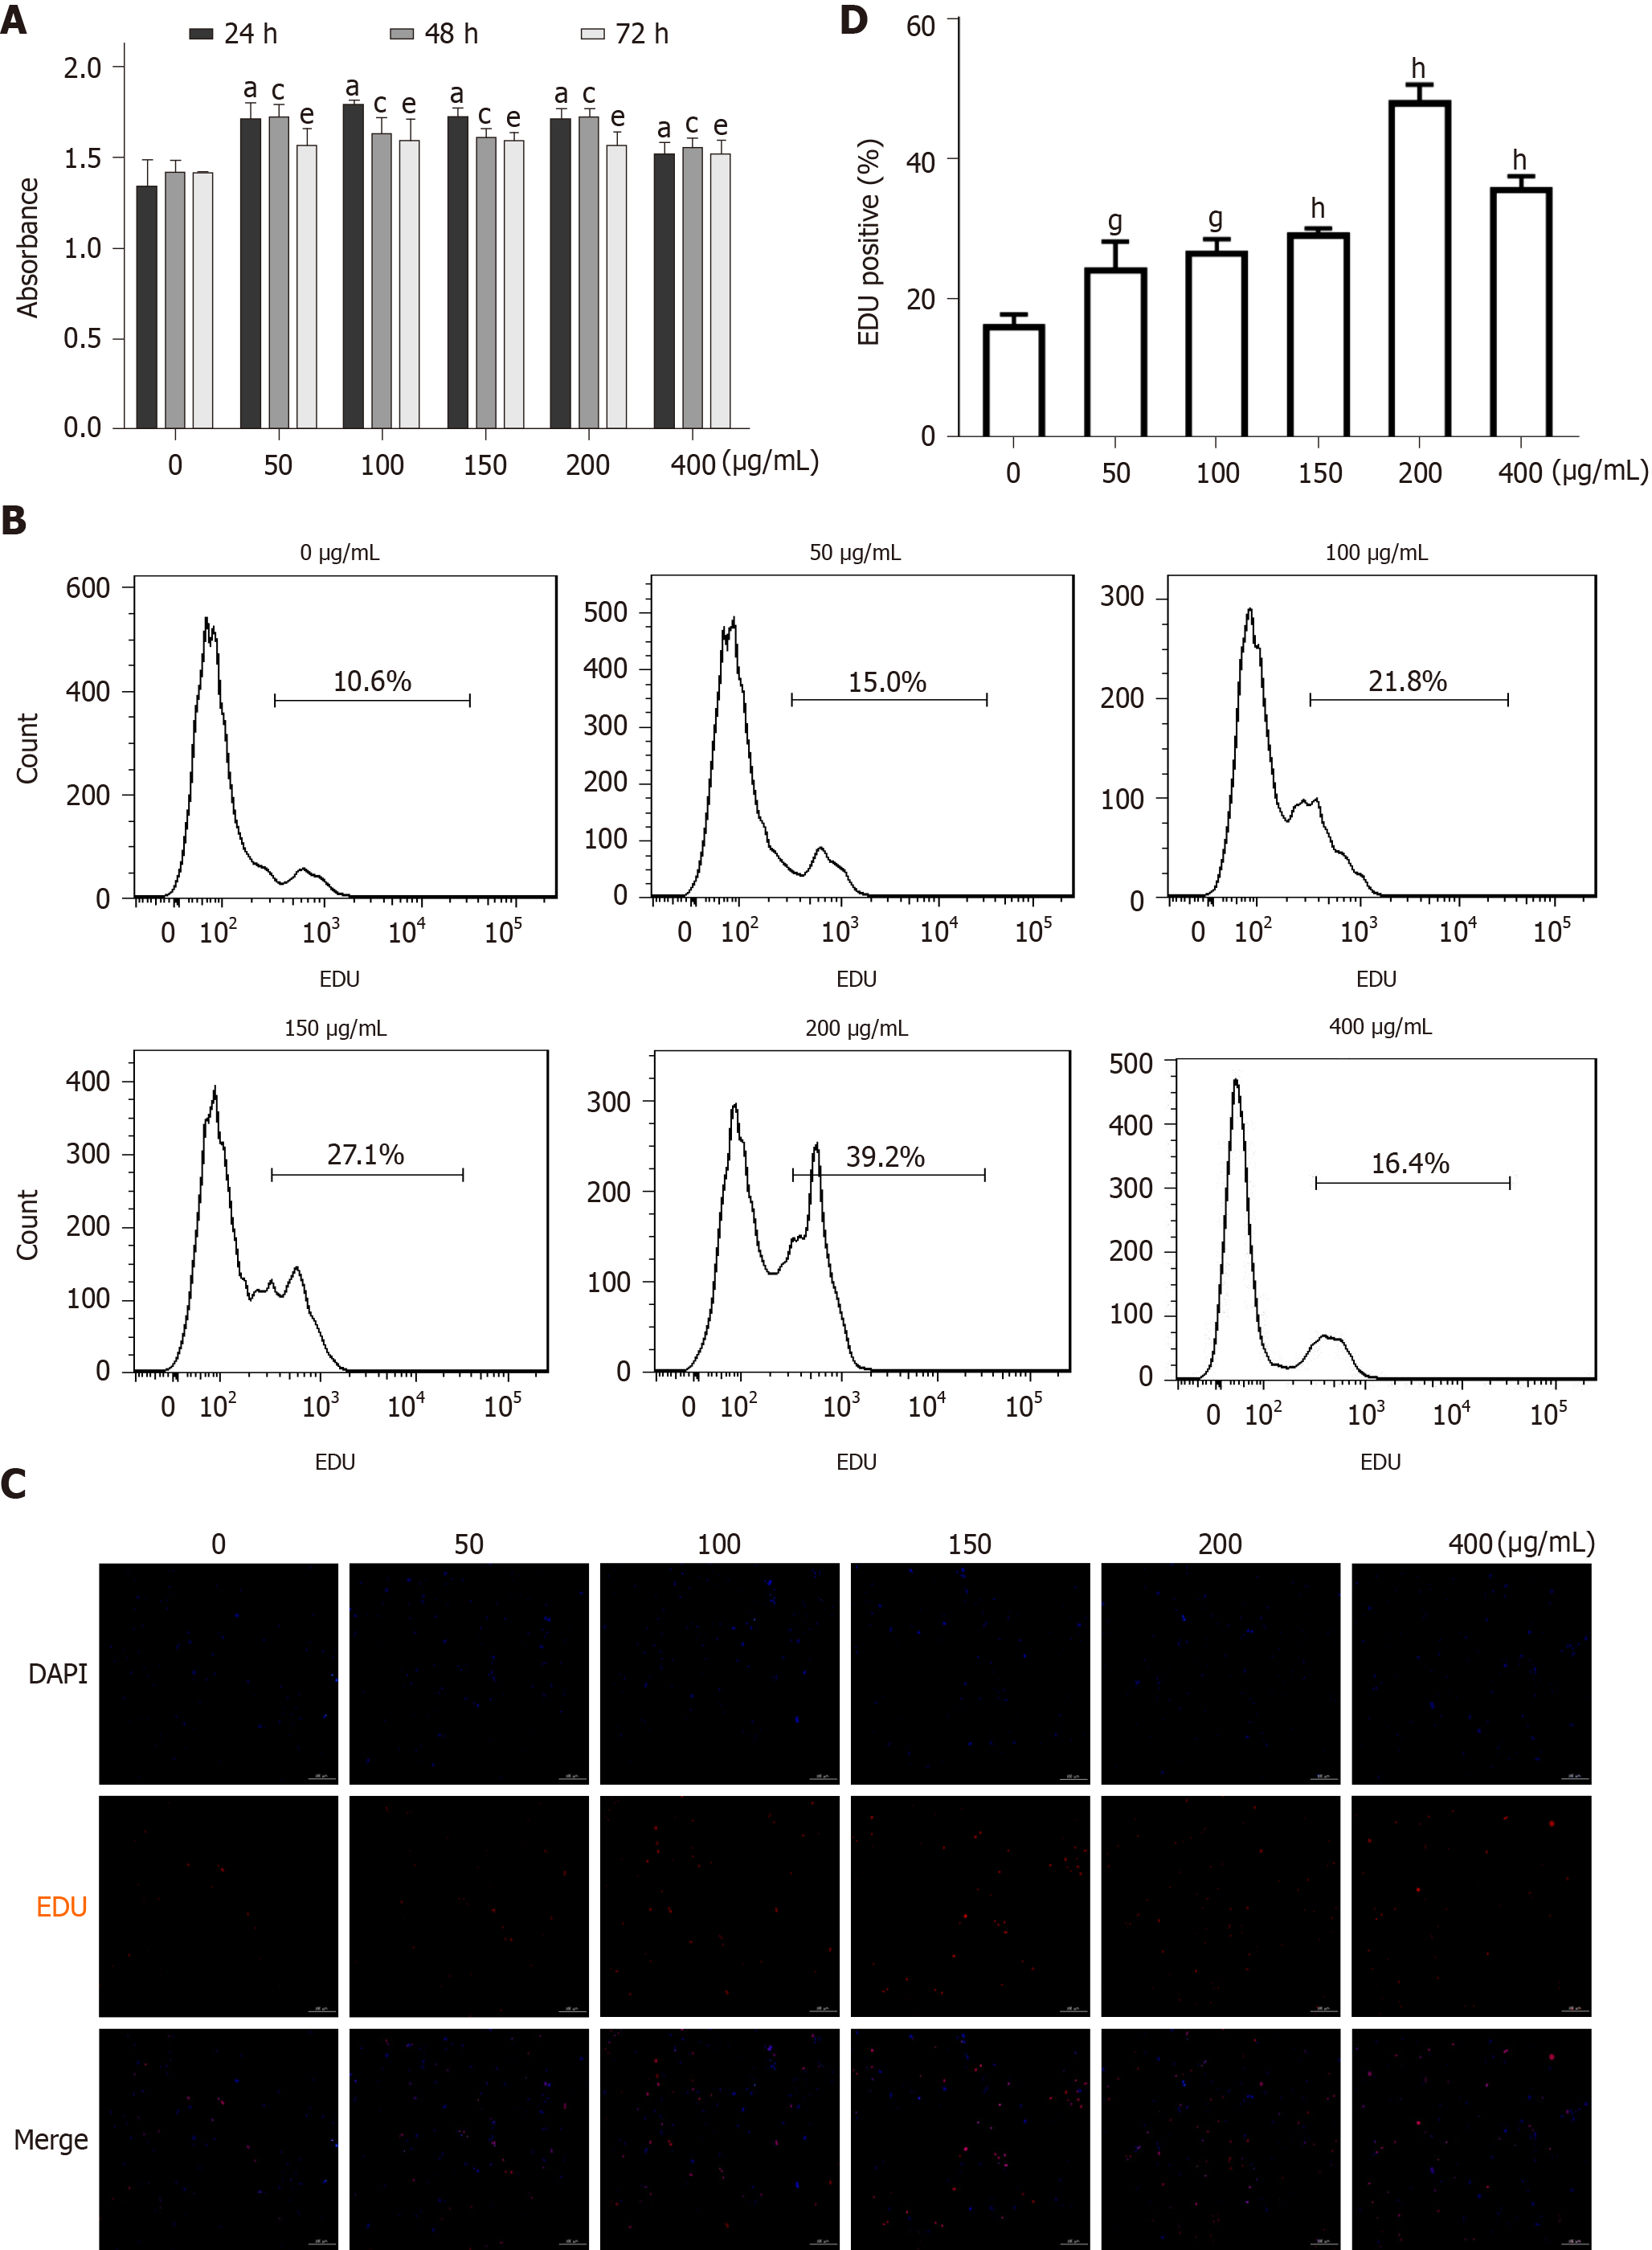
Figure 5 Effect of advanced glycation end products on the proliferation of cultured rat aortic vascular smooth muscle cells (n = 6).
A: MTT detection of the effect of incubation with advanced glycation end products (AGEs) (0, 50, 100, 150, 200, or 400 µg/mL) for different times (0, 24, 48, or 72 h) on rat aortic vascular smooth muscle cell (RASMC) proliferation. aP < 0.05 for the comparison of the 24 h control group with the control group, cP < 0.05 for the comparison of the 48 h control group with the control group, eP < 0.05 for the comparison of the 72 h control group with the control group; B: Proliferation of RASMCs treated with AGEs (0, 50, 100, 150, 200, or 400 µg/mL) for 24 h quantified using flow cytometry. Data were obtained from six independent experiments (n = 6); C: EdU staining showing the effect of incubation with AGEs (0, 50, 100, 150, 200, or 400 µg/mL) for 24 h on RASMC proliferation; D: Proliferation of RASMCs treated with AGEs (0, 50, 100, 150, 200, or 400 µg/mL) for 24 h quantified using fluorescence microscopy. gP < 0.05 compared with the control group. hP < 0.01 compared with the control group. EdU: 5-ethynyl-2-deoxyuridine.
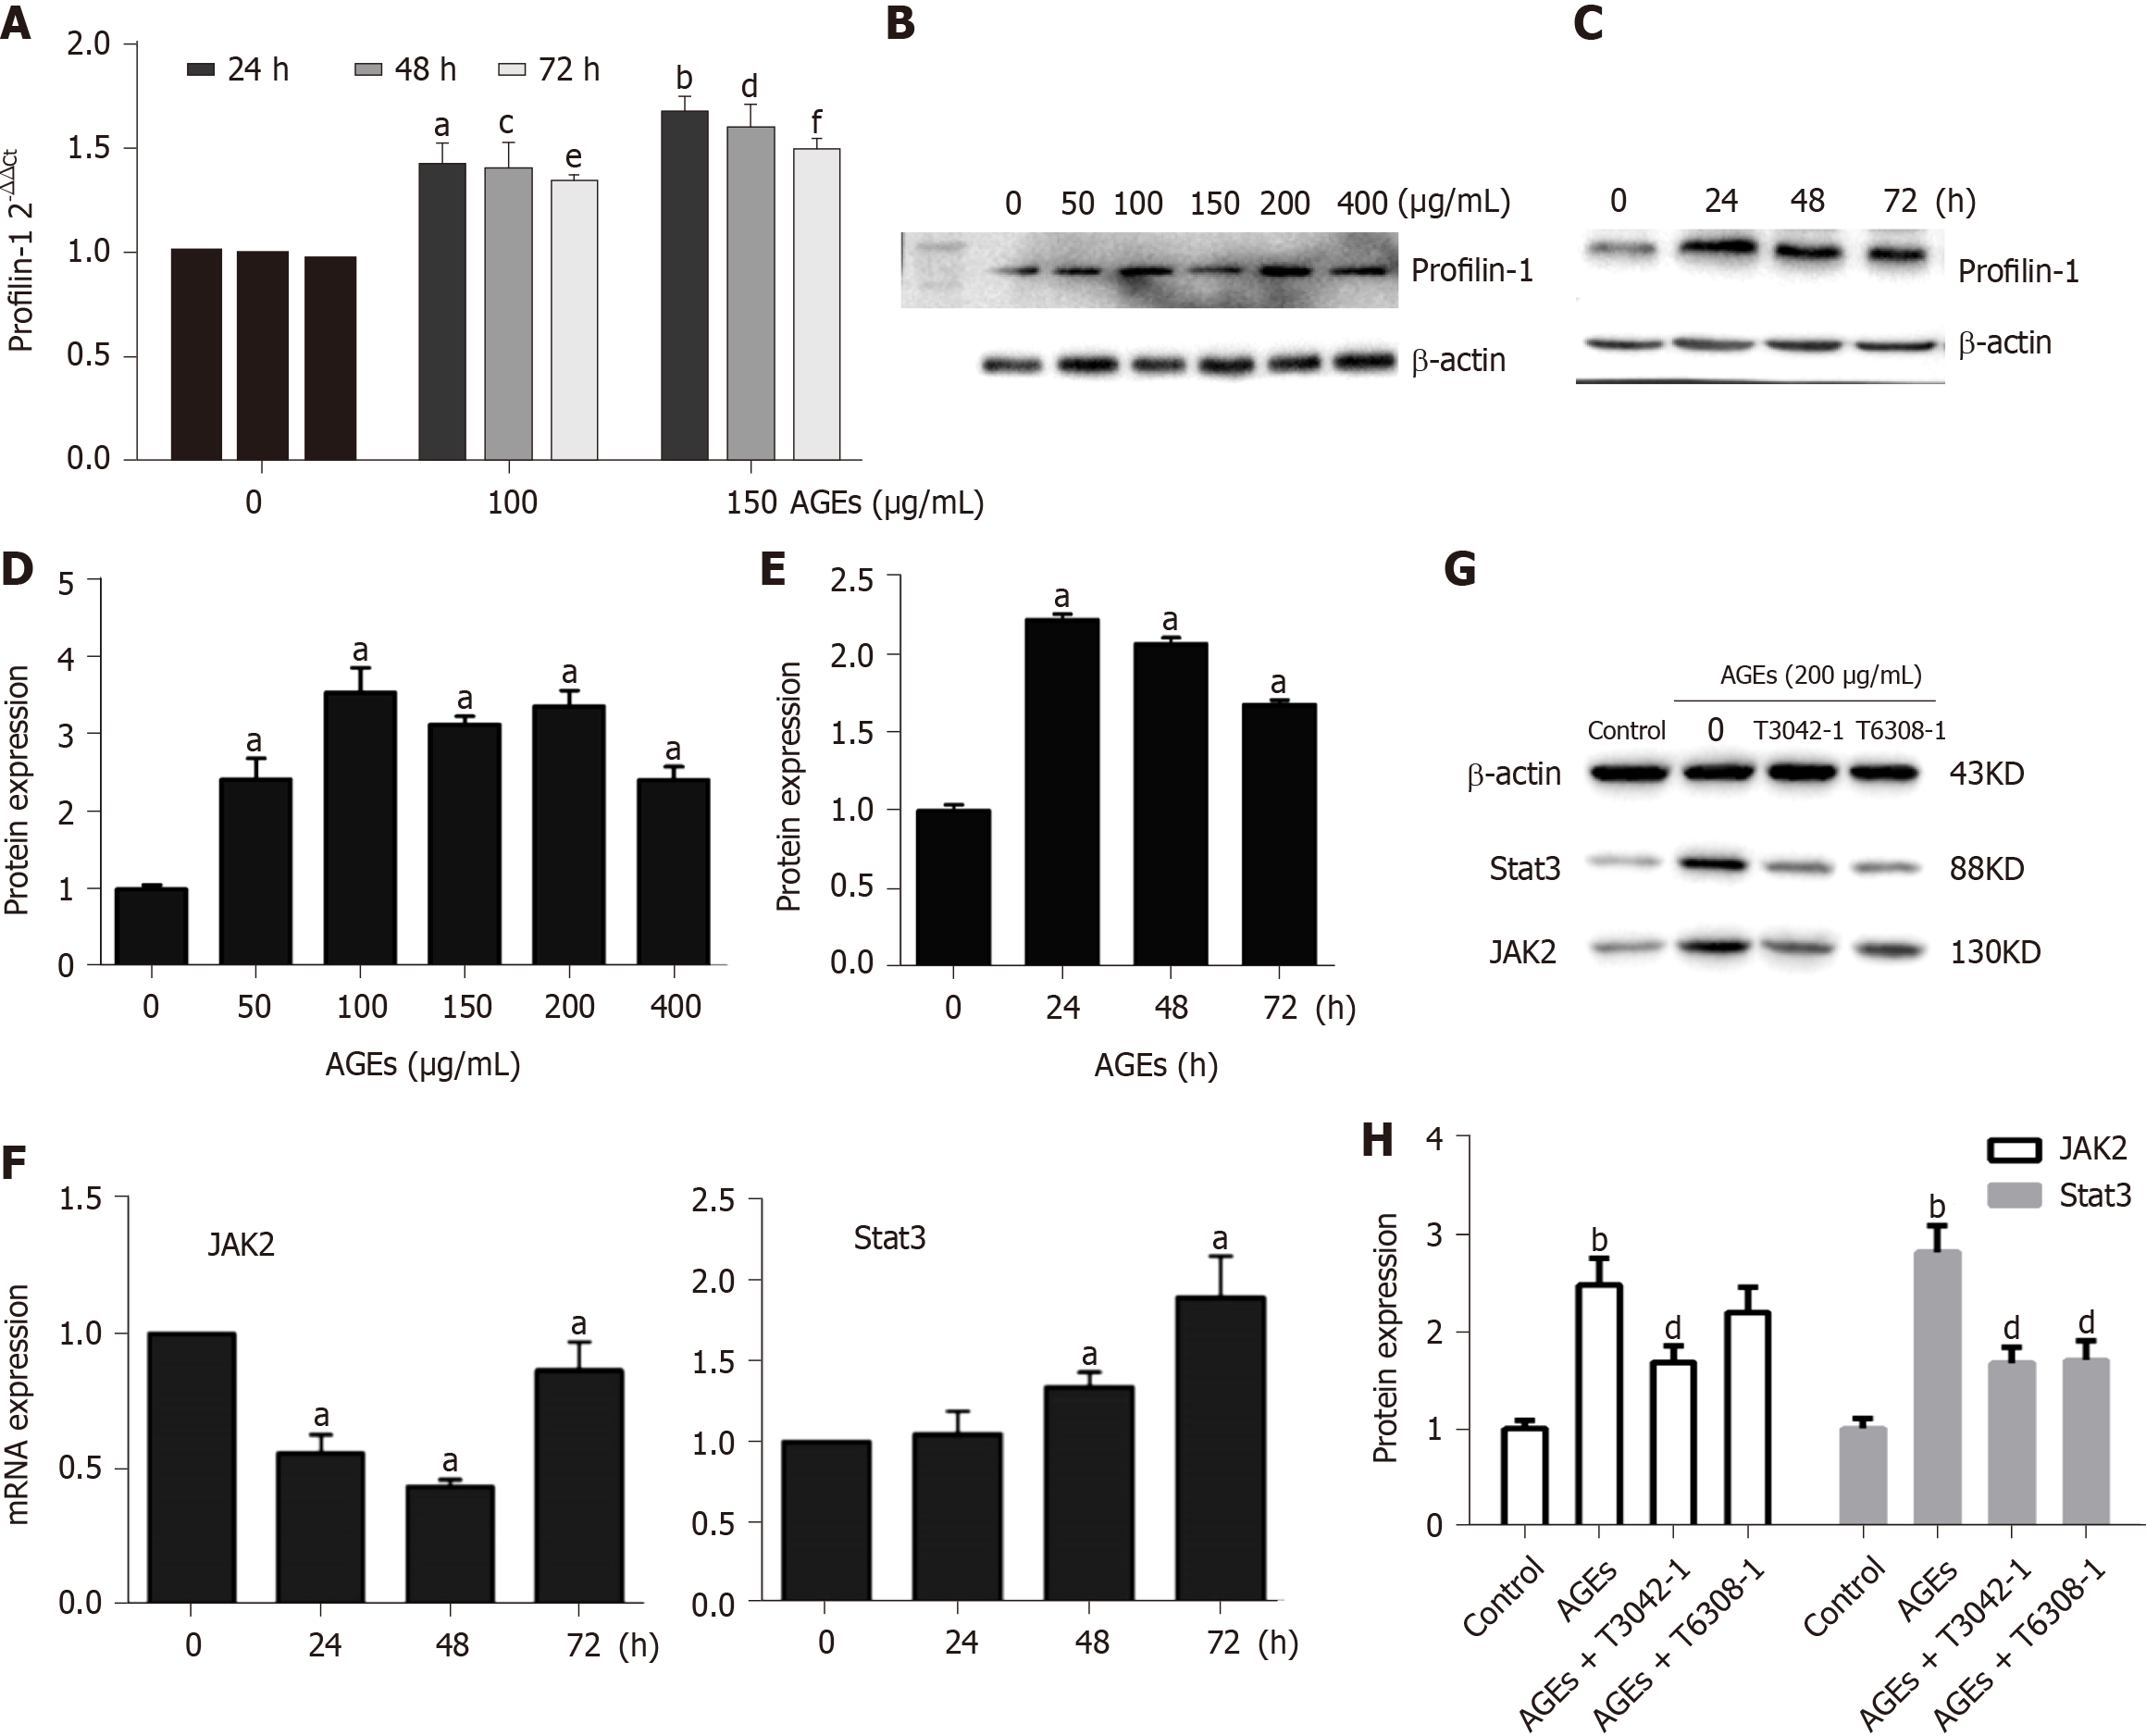
Figure 6 Involvement of profilin-1 and the Janus kinase 2/signal transducer and activator of transcription 3 pathway in advanced glycation end products-induced cell proliferation (n = 3).
A: RT-PCR analysis of the expression of the profilin-1 mRNA in rat aortic vascular smooth muscle cells (RASMCs) treated with different concentrations of advanced glycation end products (AGEs) (µg/mL) for different times. a,c,eP < 0.05 compared with the 0 control group, b,d,fP < 0.01 compared with the 0 control group; B-E: Western blot showing levels of the profilin-1 protein in RASMCs treated with different concentrations of AGEs for different times. aP < 0.05 compared with the control group; F: RT-PCR analysis of the expression of the Janus kinase 2 (JAK2) and signal transducer and activator of transcription 3 (STAT3) mRNA in RASMCs treated with 200 µg/mL AGEs for different times. aP < 0.05 compared with the 0 control group; G-H: Western blot analysis of the effect of 200 µg/mL AGEs on the expression of the JAK2 and STAT3 proteins in RASMCs treated with or without the JAK2 inhibitor (T3042-1) or STAT3 inhibitor (T6308-1). bP < 0.01 compared with the control group. dP < 0.01 compared with the AGEs group. AGEs: Advanced glycation end products; JAK2: Janus kinase 2; STAT3: Signal transducer and activator of transcription 3.
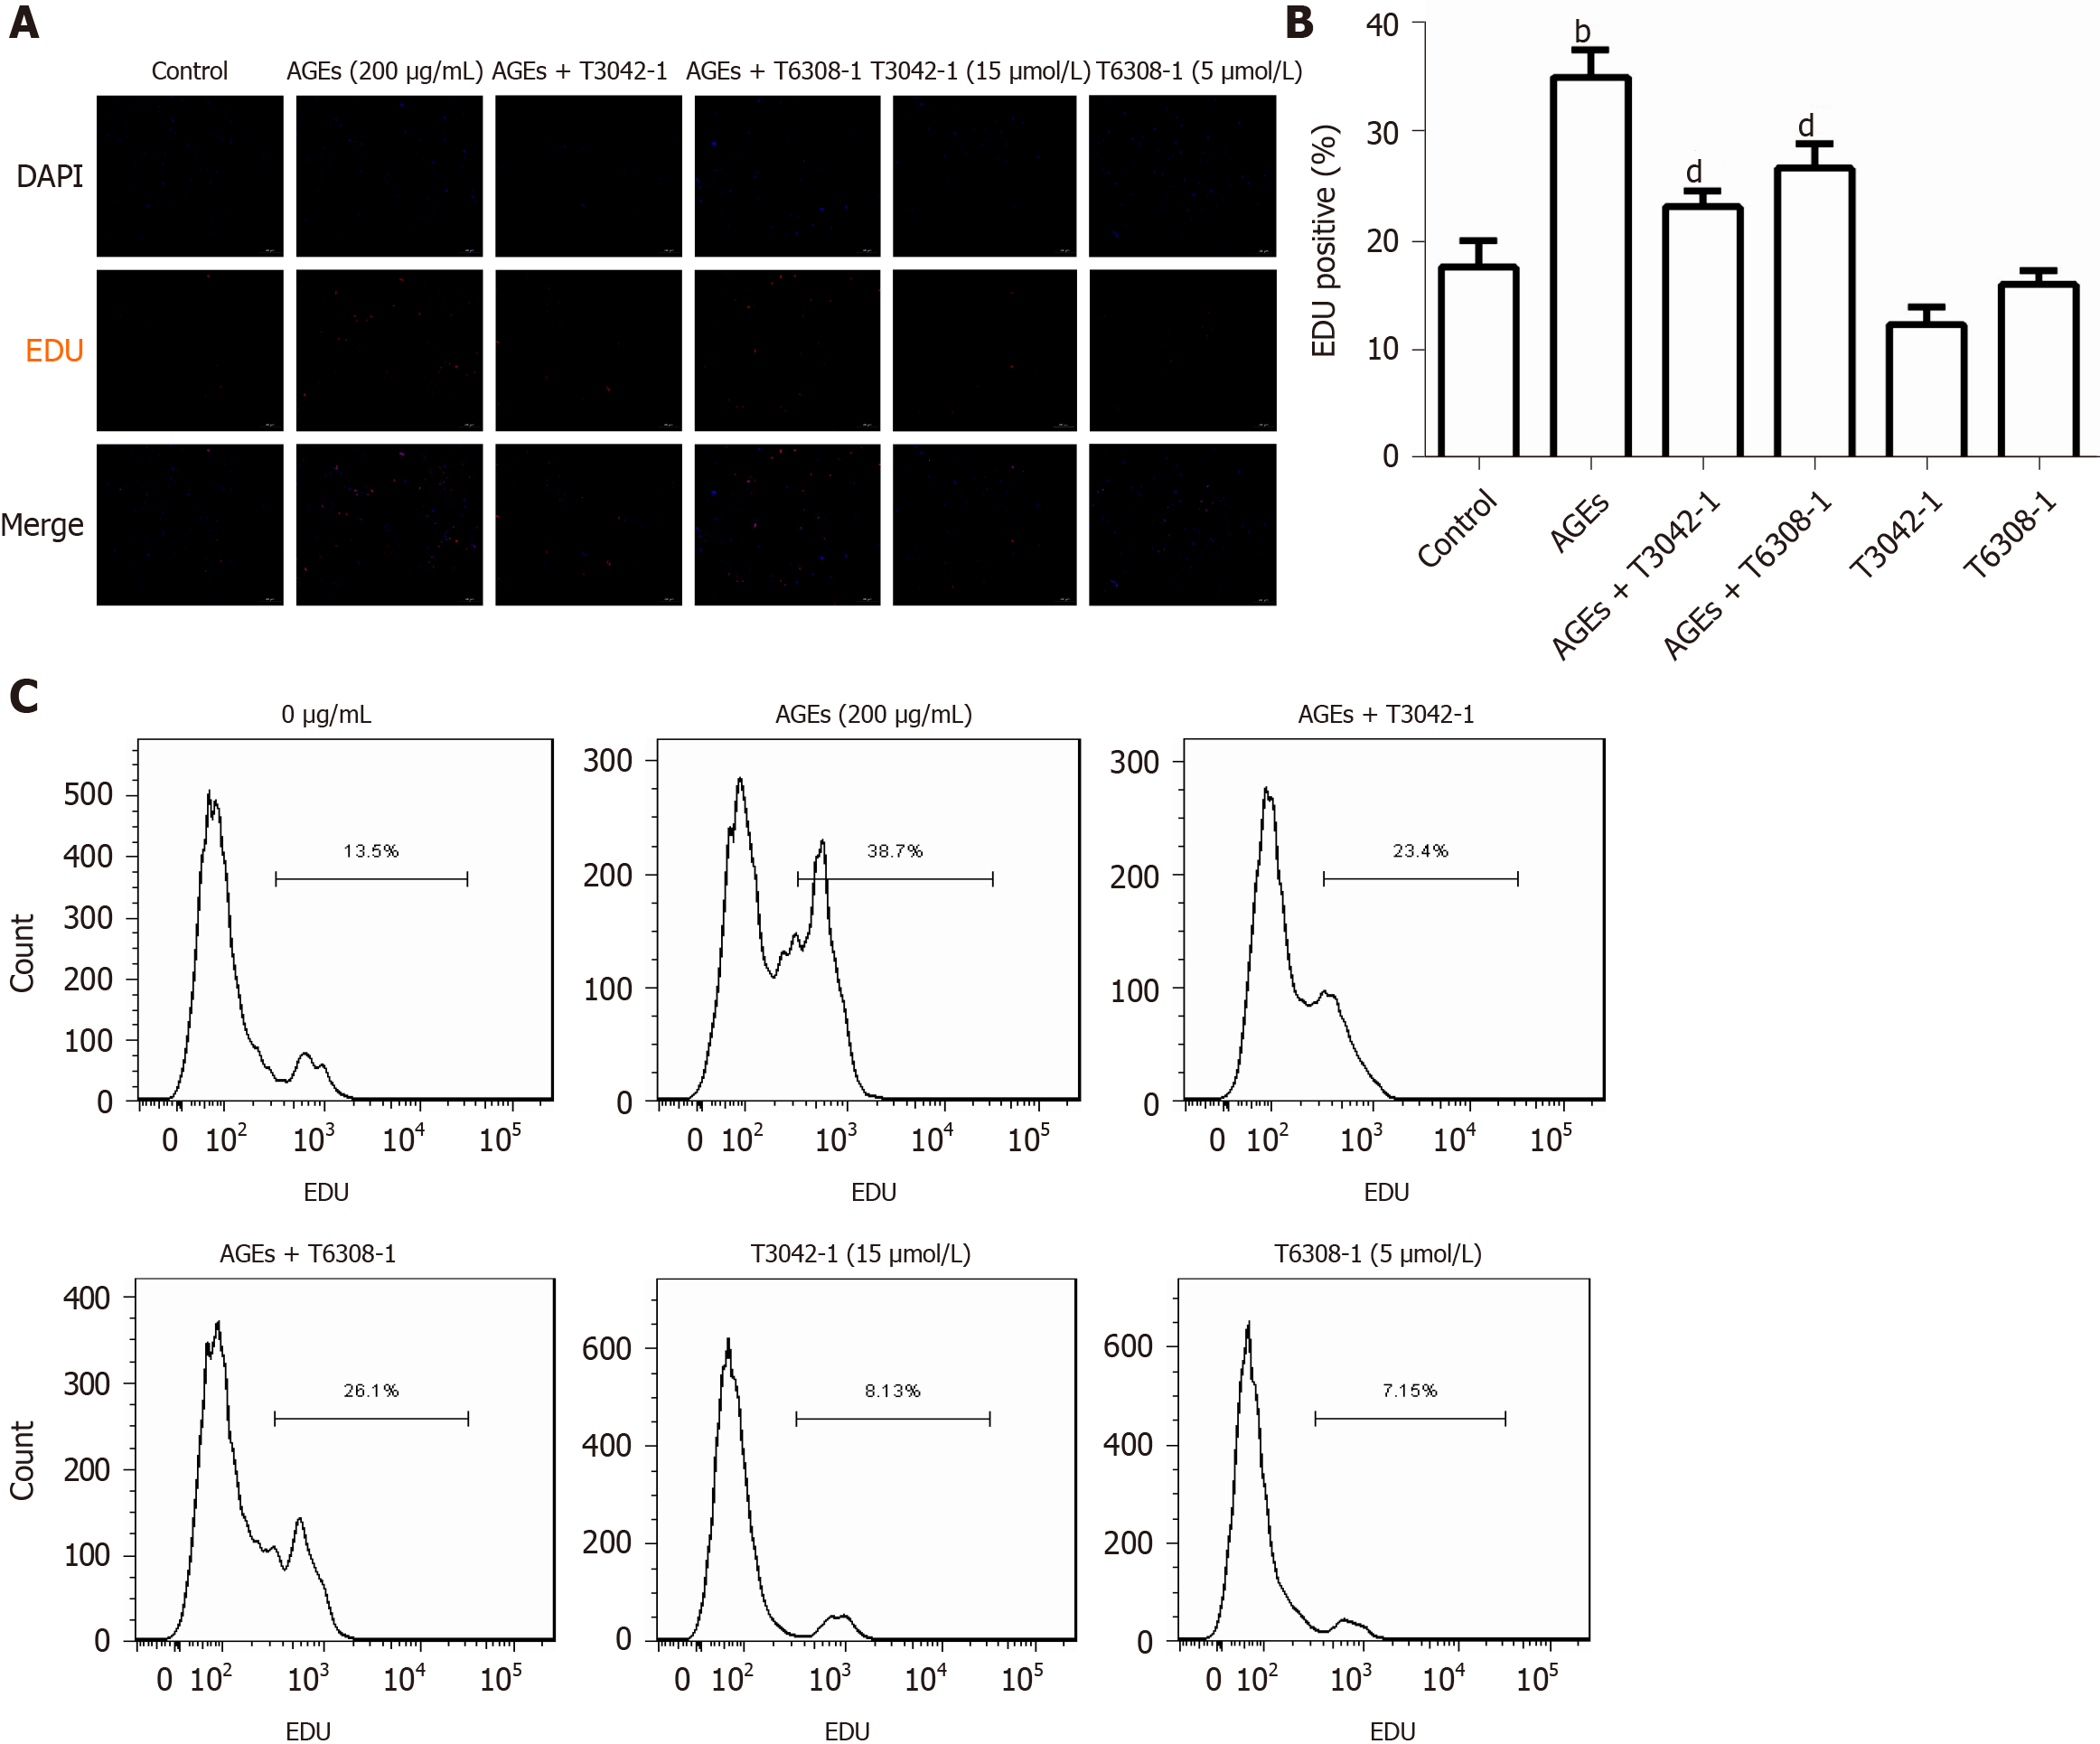
Figure 7 Effects of the Janus kinase 2 inhibitor and signal transducer and activator of transcription 3 inhibitor on advanced glycation end products-induced rat aortic vascular smooth muscle cell proliferation (n = 6).
Cells were treated with 200 µg/mL advanced glycation end products (AGEs) and/or 15 μmol/L Janus kinase 2 inhibitor (T3042-1) and/or 5 μmol/L signal transducer and activator of transcription 3 inhibitor (T6308-1). A: Fluorescence microscopy image of 5-ethynyl-2-deoxyuridine (EdU) staining; B: Percentage of EDU-positive cells in A. bP < 0.01 compared with the control group, dP < 0.01 compared with the advanced glycation end products group; C: Flow cytometry analysis of EdU staining. Data were obtained from six independent experiments. AGEs: Advanced glycation end products; EDU: 5-ethynyl-2-deoxyuridine.
- Citation: Xiao ZL, Ma LP, Yang DF, Yang M, Li ZY, Chen MF. Profilin-1 is involved in macroangiopathy induced by advanced glycation end products via vascular remodeling and inflammation. World J Diabetes 2021; 12(11): 1875-1893
- URL: https://www.wjgnet.com/1948-9358/full/v12/i11/1875.htm
- DOI: https://dx.doi.org/10.4239/wjd.v12.i11.1875


