Copyright
©The Author(s) 2021.
World J Diabetes. Nov 15, 2021; 12(11): 1875-1893
Published online Nov 15, 2021. doi: 10.4239/wjd.v12.i11.1875
Published online Nov 15, 2021. doi: 10.4239/wjd.v12.i11.1875
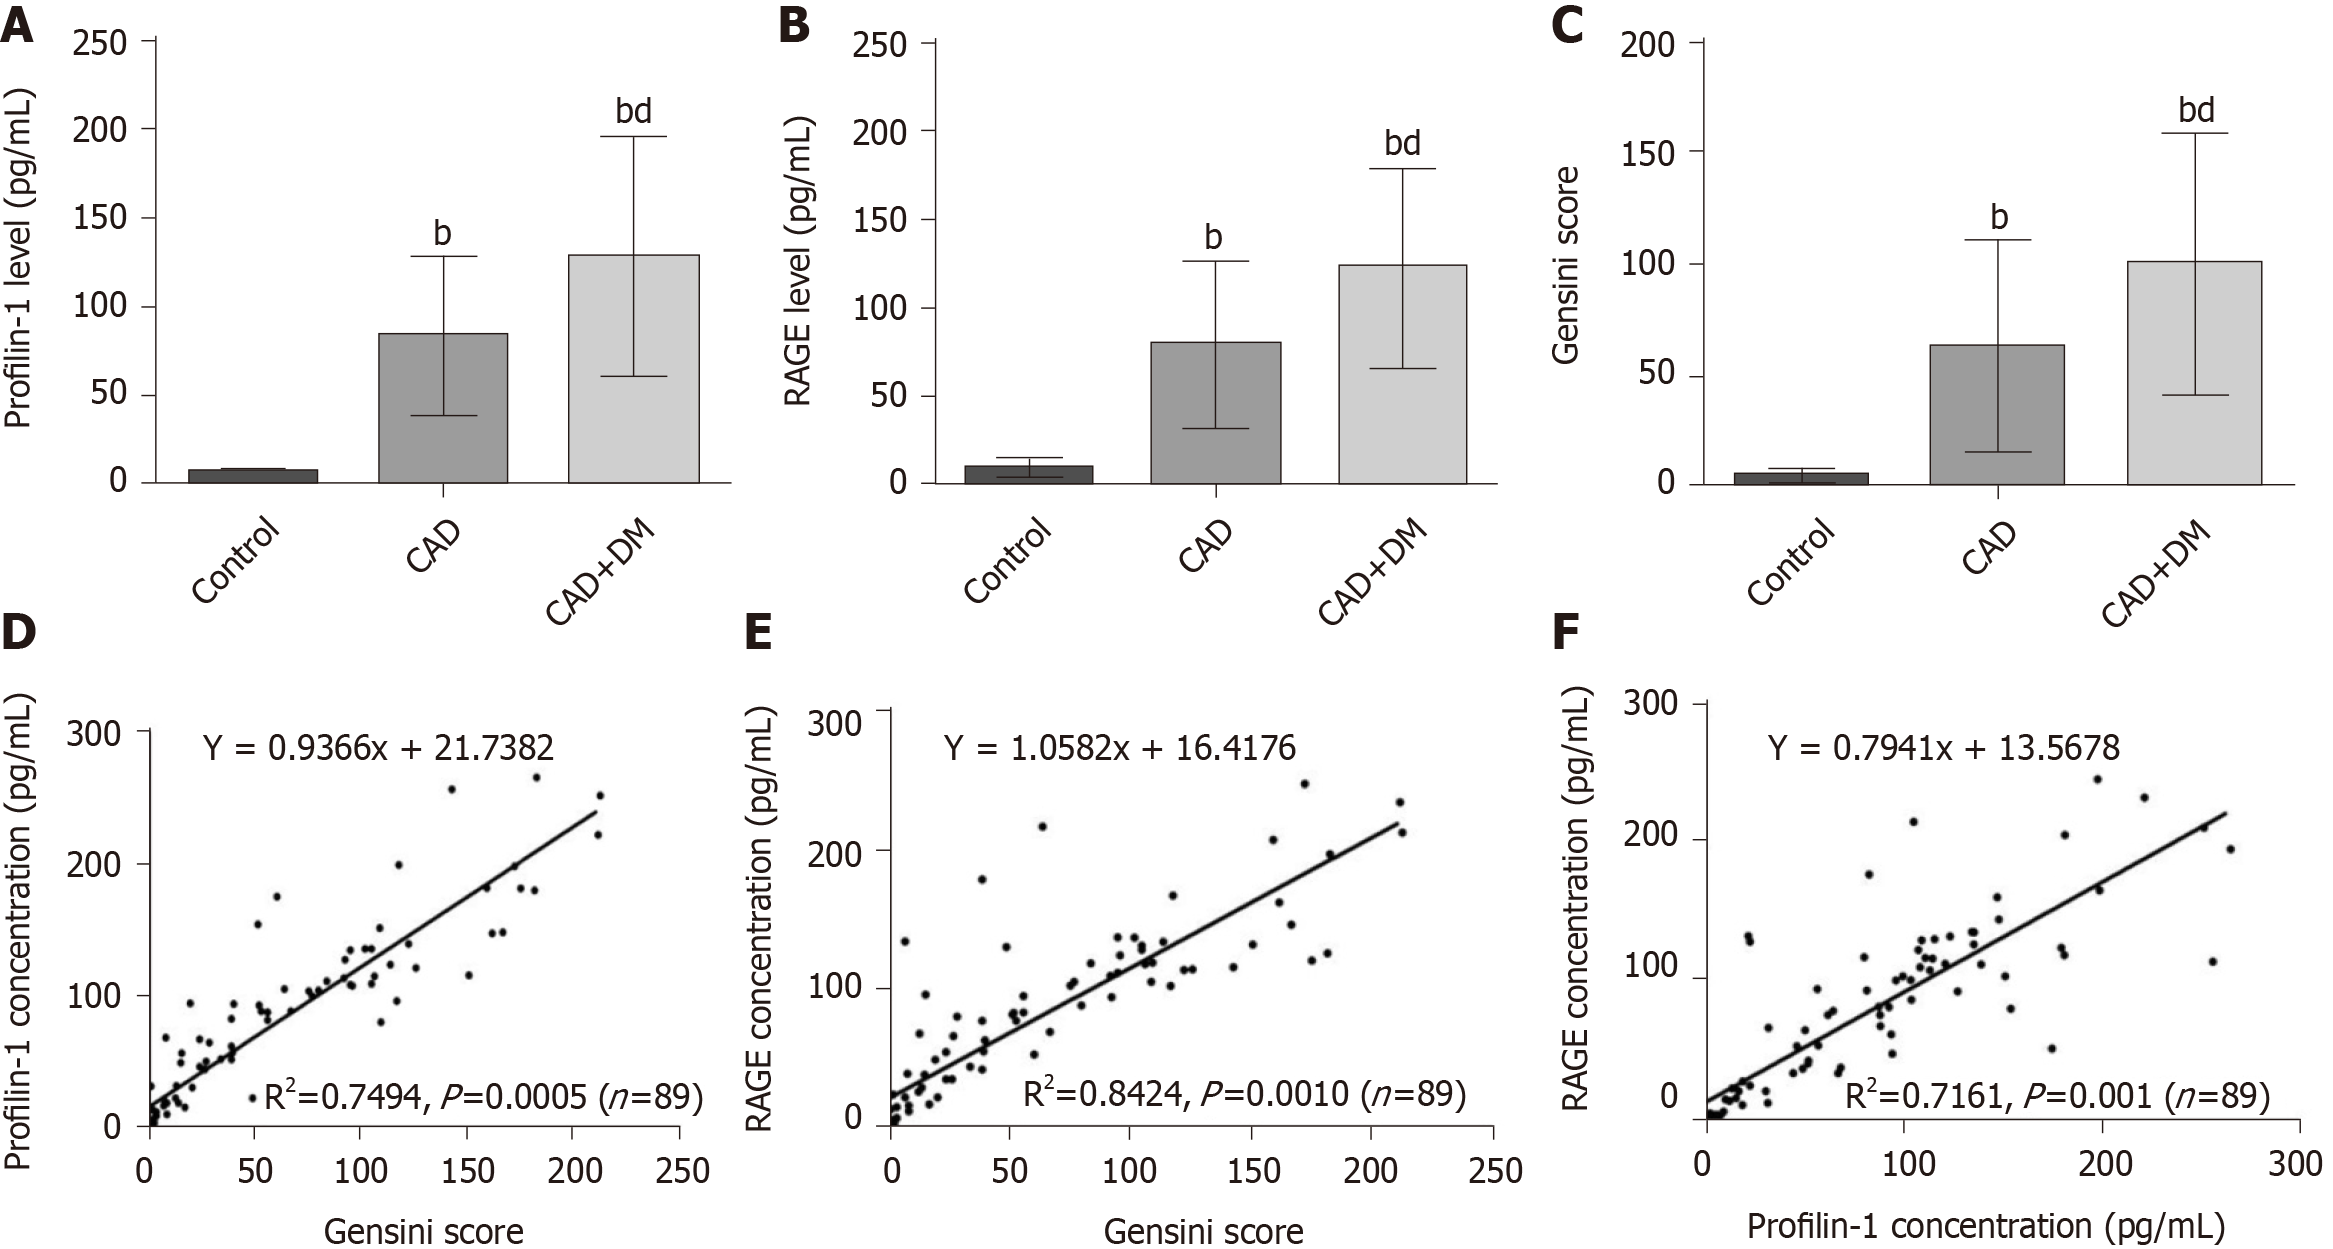
Figure 1 Relationships between profilin-1, receptor for advanced glycation end products, and Gensini scores.
A-C: Plasma profilin-1 and receptor for advanced glycation end products (RAGE) levels and Gensini scores in different groups. bP < 0.01 compared with the control group, dP < 0.01 compared with the coronary artery disease group; D-F: Pearson correlation analysis showing the relationship between profilin-1 or RAGE levels and Gensini score, as well as the relationship between profilin-1 and RAGE levels. CAD: Coronary artery disease; DM: Diabetes mellitus; RAGE: Receptor for advanced glycation end products.
- Citation: Xiao ZL, Ma LP, Yang DF, Yang M, Li ZY, Chen MF. Profilin-1 is involved in macroangiopathy induced by advanced glycation end products via vascular remodeling and inflammation. World J Diabetes 2021; 12(11): 1875-1893
- URL: https://www.wjgnet.com/1948-9358/full/v12/i11/1875.htm
- DOI: https://dx.doi.org/10.4239/wjd.v12.i11.1875


