Copyright
©The Author(s) 2016.
World J Gastrointest Oncol. Feb 15, 2016; 8(2): 186-197
Published online Feb 15, 2016. doi: 10.4251/wjgo.v8.i2.186
Published online Feb 15, 2016. doi: 10.4251/wjgo.v8.i2.186
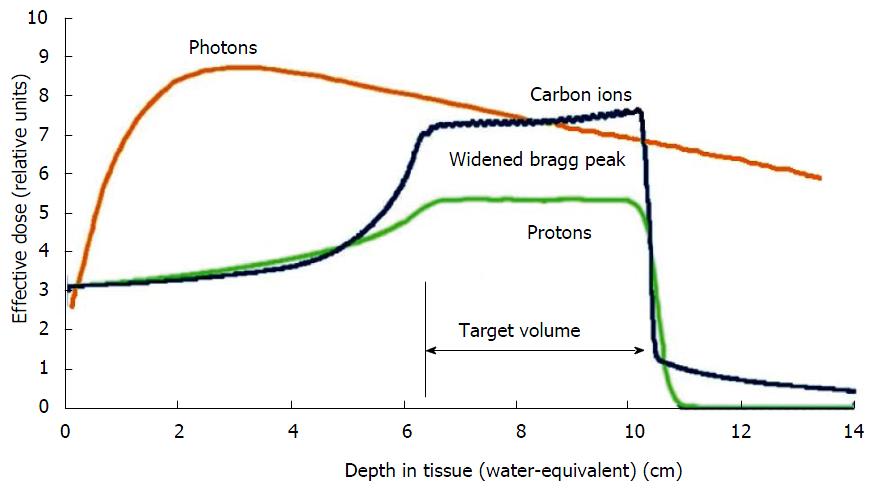
Figure 3 Schematic comparison of the depth dose curves of photons and particles.
Lower dose distribution in the radiation path before and after the target with particles by exploiting the Bragg-peak.
- Citation: Roeder F. Neoadjuvant radiotherapeutic strategies in pancreatic cancer. World J Gastrointest Oncol 2016; 8(2): 186-197
- URL: https://www.wjgnet.com/1948-5204/full/v8/i2/186.htm
- DOI: https://dx.doi.org/10.4251/wjgo.v8.i2.186


