
















Copyright: ©Author(s) 2026.
World J Gastrointest Oncol. May 15, 2026; 18(5): 116568
Published online May 15, 2026. doi: 10.4251/wjgo.v18.i5.116568
Published online May 15, 2026. doi: 10.4251/wjgo.v18.i5.116568
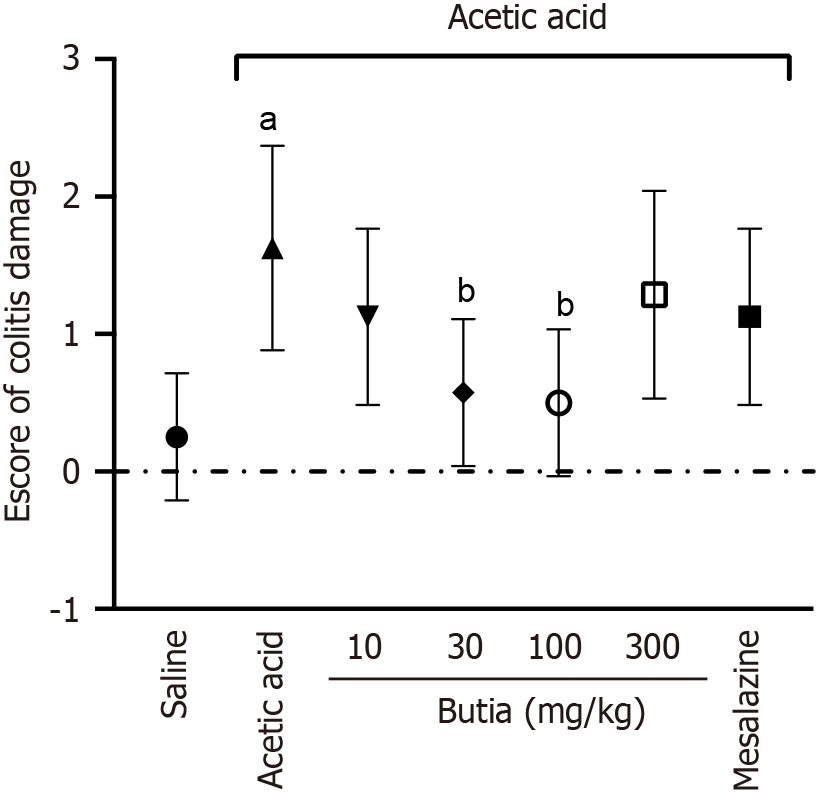
Figure 4 Macroscopic indices of colonic segments from mice with induced colitis post-treatment.
Scores: 0 = no lesion; 1 = focal hyperemia without ulceration; 2 = ulceration without hypertrophy of the intestinal wall; 3 = ulceration with inflammation spot according to Wallace et al[18]. Results presented ± representative error of 8 animals per group. aP < 0.05 vs saline group; bP < 0.05 vs acetic acid. One-way analysis of variance followed by Tukey’s t-test. Error bar: Standard error of the mean.
- Citation: Da Silva PB, Lopes-Bute L, Fischer J, Parcianello AP, Pires-Duarte R, Luiz RM, Brandalize APC, Melo FF, Wendel CF, Teixeira KN, Zarpelon-Schutz AC. Protective effects of Butia capitata extract against colitis-driven colorectal tumorigenesis: Insights into its anti-inflammatory and antinociceptive activities. World J Gastrointest Oncol 2026; 18(5): 116568
- URL: https://www.wjgnet.com/1948-5204/full/v18/i5/116568.htm
- DOI: https://dx.doi.org/10.4251/wjgo.v18.i5.116568